

 الأكثر زيارة

 رد مع اقتباس


عروض شركات الفوركس
 |  |  | |  |  |  |

 عضو المتداول العربي
HPQ HP Inc Earnings Report and Price Analysis for 08/23/17
According to Nasdaq.com, NYSE HPQ HP Inc. is expected to report earnings on 08/23/2017 after market close. The report will be for the fiscal Quarter ending Jul 2017. According to Zacks Investment Research, based on 6 analysts’ forecasts, the consensus EPS forecast for the quarter is $0.42. The reported EPS for the same quarter last year was $0.48. Last quarter, the company posted a positive earnings surprise of 2.6%. Notably, the stock surpassed the Zacks Consensus Estimate thrice and came in line once, over the trailing four quarters. It has an average positive earnings surprise of 3%.
Few Words about NYSE:HPQ. HP Inc. (also known as Hewlett Packard) is an American technology company leading as a global provider in computing and imaging solutions and services for business and home. The company is focused on capitalizing on the opportunities of the Internet and the proliferation of electronic services. Its major businesses include Imaging and Printing Systems, Computing Systems and Information Technology Services. HPQ was formed on November 1, 2015 out of the personal computer and printer divisions of the original Hewlett-Packard Company, with its enterprise products and services businesses becoming Hewlett Packard Enterprise. The split was structured so that Hewlett-Packard changed its name to HP Inc. and spun off Hewlett Packard Enterprise as a new publicly traded company. HP Inc. retains Hewlett-Packard’s pre-2015 stock price history and its former stock ticker symbol, HPQ, while Hewlett Packard Enterprise trades under its own symbol, HPE.
Regarding the coming earnings, Zacks.com model does not support that HP will likely beat the Zacks Consensus Estimate in its upcoming release due to that fact that Earnings ESP, which represents the difference between the Most Accurate estimate and the Zacks Consensus Estimate, is currently pegged at 0.00%. This is because the Most Accurate estimate of 42 cents comes in line with the Zacks Consensus Estimate. One more reason for the above assumption is that HP carries a Zacks Rank #2. Though this increases the predictive power of ESP, the company’s ESP of 0.00% makes surprise prediction difficult.
Despite that, many analyst hold Bullish HPQ due to the following reasons:
HP is the leader in Printing Company World Wide especially after September 12, 2016 announcement that Hewlett Packard NYSE:HPQ set to buy Samsung Electronics’ OTC:SSNLF printer business for a cash payment of $1.05 billion. The acquisition is expected to close in 2017 and is expected to be accretive in the first full year following closing. After closing, Samsung has agreed to make a $100 million to $300 million equity investment in HP through open market purchases.
Numerous Studies surfing the internet indicating by various Price Valuation Models, HPQ Stock price still remains relatively undervalued.
When it comes to our view relating to NYSE:HPQ, in the weekly time frame we remain overall Bullish the Stock. At this stage we would like to see a break above the multi year descending trend line around the 20’s and from there expect price to extend to the 22’s – 25’s area to reach the equal legs – 1.236% extension from the 11/19/2012 cycle’s lows at 5.16 before price could see sellers and correct lower. Note, HPQ can see a continuation in the pull back towards the supporting trendline around the level of 17.80’s before extend higher or see at least a 3 wave bounce against the highs at 19.60’s.
HPQ HP Inc Weekly
In the case of new highs above 24.85’s (wave b red) then the Stock will mark a incomplete bullish sequence in the weekly time frame from 07/22/2002 and from there recommend the buying the dips in 3 7 or 11 swings.
موقوف
could you give us usdjpy ?
عضو المتداول العربي
USDJPY Elliott Wave View: Turning Lower
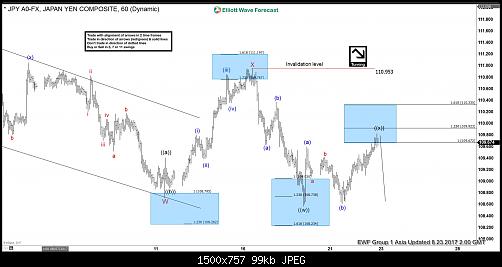
Short term USDJPY Elliott wave view suggest that the decline from 7/11 peak is unfolding as a double three Elliott wave structure. Decline to 108.71 low ended Minor wave W and Minor wave X bounce ended at 110.95 peak. Subdivision of Minor wave Y is unfolding as a Zigzag structure. Minute wave ((w)) of ((Y) ended at 108.59 low and Minute wave ((x)) of (Y) bounce is proposed complete at 109.82.
However, a break below 108.59 is needed to add conviction to this view. Until then a double correction in Minutte wave ((x)) can’t be ruled out. Near term, as far as pivot from 110.95 peak stays intact, expect pair to extend lower in Minute wave ((y)) or pullback in 3 waves at least. We don’t advise buying the pair and expect more downside in the pair towards 107.46-106.92 area next before a bounce is seen.
USDJPY 1 Hour Elliott Wave Chart
متداول متميز / مشرف سابق
hi , could you give me
'' gbp/jpy + eur/nzd '' ?
عضو المتداول العربي
USDJPY Elliott Wave view: Resuming lower
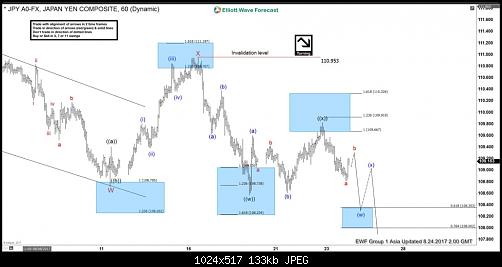
Short term USDJPY Elliott wave view suggest the decline from 7/11 peak is unfolding as a double three Elliott wave structure. Decline to 108.71 low ended Minor wave W and Minor wave X bounce ended at 110.95 peak. Subdivision of Minor wave Y is unfolding as a Zigzag structure. Minute wave ((w)) of ((Y) ended at 108.59 low and Minute wave ((x)) of (Y) bounce ended at 109.82. The pair has reacted lower from the blue box, but the move lower will get validation only with a break below 108.59. Until then a double correction in Minutte wave ((x)) still can happen.
Down from 108.59, Sub Minutte wave a of (y) ended at 108.82 low and the pair is in Sub Minutte wave b bounce to correct the decline from 109.82 peak. Near term, while bounces fail below 109.82 peak and more importantly below 110.95, expect pair to extend lower. Initial target to the downside is 108.35-108 area to complete Minutte wave (w). Afterwards, pair should bounce in Minutte wave (x) before the decline resumes. We don’t advise buying the pair and expect more downside in the pair as far as bounces fail below 110.95 peak.
USDJPY 1 Hour Elliott Wave Chart
عضو المتداول العربي
This was Asia Chart for GBPJPY calling for a short term bounce that should fail around the descending trendline for more downsideالمشاركة الأصلية كتبت بواسطة hema007

I can't share more charts to respect the copyright and privileges of the clients
متداول متميز / مشرف سابق
Ok , thank you bro
عضو المتداول العربي
You Are welcome
عضو المتداول العربي
could you give me
eur/usd
موقوف
اليوت دائما رحلة الانهائيه من التجريب ووضع الاحتمالات ومعظمها فاشل
عضو المتداول العربي
موافقة اليوت لتحليل الفرد يعطي تفاؤل باستمرار الصفقة في نفس الاتجاه
متداول متميز / مشرف سابق
هو علم مساعد لتحليلك , تقدر تستفيد منه بهذه الطريقة بشكل جيد جداً
يكون داعم لك , و في النهاية هو بردوا علم كبير و له محترفينه و اللي بيقدروا يشتغلوا بيه
و يكسبوا بيه كمان و هناك بروكرات تستخدمه بشكل كبير في تحليلها .
عضو المتداول العربي
The Big Long in World Indices
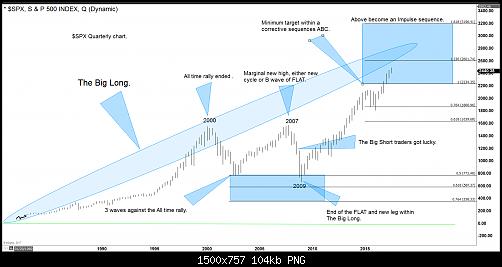
Since the decline starting from year 2000, the world has been calling for a huge crash in world indices. The world indices did in fact corrected nicely in the year 2000 and 2009. The correction took the form of a FLAT Elliott wave structure and reached 50%-61.8% of the all-time rally in most of the world indices. This correction is even recorded in a movie titled “The Big Short” telling story about a group of traders shorting the market.
The crowd does not have enough with the 50%- 61.8 % correction between year 2000 and 2009, which is almost 9 years of correction. People want more and they want a crash after another crash. However, the reality is that the Market does not work that way. Most traders do not have a long career as most believe that the World Indices trend is bearish following the 2009 decline. This is a wrong bias which has cost traders billions of dollars.
The World Indices trend will always be bullish because it’s simply the Human nature. We used to live in the cave, but now we have a nice house, hotels and many other development to make our lives more comfortable. This is called progress, and by nature, we humans always will look for something better and the Indexes are a reflection of the Human progress. We understand that corrections are needed and they will always be a part of the Market. We can say that traders who shorted in 2007 – 2008 and caught the move lower got very lucky.
The World Indices ended the all-time cycle until that moment at 4.2.2000 and pullback in 7 swings into the 776 area using the $SPX as reference. By 2002, the correction has reached 50% of the all-time rally ina corrective 7 swing structure, and technically the correction was enough and a new bullish trend could develop. The World Indices even made a new high in 2007 and then crashed into a C wave completing a flat structure. Selling wave B at 2007-2008 high into wave C lower with a new high above the previous peak at 2000 is luck. Yes the move lower happened, but selling is against the trend at that time, and whoever caught that short got lucky.
It sounds and looks easy in a movie, but it is a wrong trade. It is a mass crowd trade, and we know better. We proposed “The Big Long” instead, which is more natural and easier to trade with no pain. The Index has rallied since 2009 and this rally is the good side of the Market, the one with no pain. The trend is always smoother and more natural, but most of the time the crowd does not see the trend. We do understand The Big long has reached the minimum target at 2234, if it is labelled as an ABC or a corrective sequence. However, the Market is saying more upside is possible and 3197 can still be reached if the Big Long becomes an extended Big Long.
Trading is about reading the Market and understanding the natural path and not forcing against the trend. We keep and will keep calling extension and buy into The Big long because we understand that pickers got it right one time and wrong 9 times. We would rather get it right 9 times and wrong 1 time. As we always said, nobody is 100% correct and it is impossible to be perfect, but when you trade the trend it becomes easier. The Big Short which everyone is waiting is a crowd and popular trade. The reality is that few people look the other side which is the Big long. This side is not over and can become extended Big Long.
SPX Elliott Wave Chart
عضو المتداول العربي
Royal Gold Bullish Structure Calling Higher
Royal Gold (NASDAQ: RGLD) is one of the world’s leading precious metals royalty & stream companies, it’s engaged in the acquisition and management of gold, silver, copper, lead and zinc. The Company owns interests on 194 properties in over 20 countries, including interests on 39 producing mines and 21 development stage projects.
During last week, Royal Gold announced fourth quarter dividend of US$0.24 per share of common stock payable on October 20, 2017. It’s stock price closed on Friday at new 5 years high with a total gain of +37% YTD and +250% from last year low.
The recent move higher during the month of August was significantly important for the stocks because the price managed to break above the 2016 peak and that opened a new extension to the upside. So let’s take a look at RGLD technical chart.
Royal Gold Elliott Wave Technical Analysis
RGLD rallied from 01/20/2016 low before topping at $87.74 on 08/02/2016. That peak held for 1 year in which the stock corrected for 4 months before resuming the move higher and finally managing to break it on 08/10/2017. Royal Gold is now showing an incomplete 5 swings bullish sequence from 2016 low and the stock is expected to continue to the upside toward the minimum target at equal legs area $123 – $138 with a possible extension toward $162.
RGLD Weekly Chart
Using Elliott Wave theory, we can label the move from 2016 low as a start of a 5 waves diagonal so that could be forming wave (III) or only the first leg of it because the 3rd wave usually extend toward the 1.618 fib ext level which will come around $187.
Royal Gold still needs to break above 2012 peak to confirm the bullish move higher and open another bullish sequence. So either way, the move will extend higher as 5 waves or will end up as 3 waves Zigzag ABC from 1991 low. The equal legs from there comes at $125 – $149 which is around the same extreme area from 2016 suggesting that the stock could see a pullback from that area before deciding the next path.
RGLD Monthly Chart
Recap
Royal Gold technical picture is strongly bullish after the recent break higher and that’s why buyers can be seen now during pullbacks in 3 , 7 or 11 swings with targets higher above $120 area unless the move higher is part of a flat structure which means it will still do another leg lower against 2016 before rallying again. The stock is getting support from the commodity sector overall and especially of rise in the price of precious metals.
عضو المتداول العربي
BBY Best Buy Earnings Report 08/29/17 – Weekly ElliottWave Count
BBY Best Buy Inc. earnings report due to this week, the 29th of August. Before we get into the details few words about the company we are about to analyze.
According to Wikipedia, Best Buy Co. (NYSE: BBY), Inc. is an American multinational consumer electronics corporation headquartered in Richfield, Minnesota, a Minneapolis suburb. Internationally, it also operates in Canada and Mexico. It was formerly operational in China until February 2011 (when the faction was merged with Five Star) and in Europe until 2012. According to Yahoo! Finance, Best Buy is the largest specialty retailer in the U.S. consumer electronics retail industry.
Regarding earning, Best Buy Co., Inc. is expected to report earnings the 29th of August 2017 before market open. The report will be for the fiscal Quarter ending Jul 2017. According to Zacks Investment Research, based on 12 analysts’ forecasts, the consensus EPS forecast for the quarter is $0.63. The reported EPS for the same quarter last year was $0.57.
Overall view, Best Buy (NYSE: BBY) shares are surging this year, a company many investors though was in big trouble because of the threat from Amazon. The stock is up by 55% this year and up by approximately 240% since the company named Hubert Joly as its CEO five years ago.
Main reasons why BBY Best Buy has been surging:
The Nintendo Switch console launch
Best Buy proved Amazon-proof in contrast with Circuit City and RadioShack
Despite the very encouraging data, it is worth to mention that the BBY stock is well behind AMZN’s performance. Since August 2012, AMZN stock is up by 300% yet if we account the S&P 500 is up by 75% during the same time frame and while the S&P Retail ETF (XRT) has risen only 25%, BBY Best Buy still has an astonishing performance.
Coming back to the Earnings subject, Jefferies raised Best Buy Sales and Earnings estimates on Tuesday for the second quarter, citing strength in the video game, appliance and smartphone categories.
“Based on our field checks and other research, we believe Best Buy should be able to grow domestic SSS [same-store sales] at the high end or better than mgmt.’s plan,” analyst Daniel Binder wrote in a note to clients. “We expect Best Buy to benefit from strength in appliances and connected home, however we also expect robust growth in entertainment from the introduction of two gaming consoles in Q1 and mobile to benefit from a full quarter of Samsung S8/S8+ availability.”
“We believe that Best Buy’s entertainment category saw a second consecutive quarter of robust growth driven by the launch of the Nintendo Switch and the 1TB PlayStation Slim Gold console as the company laps fairly significant comparable store sales declines in this category,” he wrote.
As a result, the analyst raised his July quarter Best Buy U.S. same-store sales growth estimate to 2.5 percent from 2.0 percent. He also increased his earnings-per-share forecast for the same quarter to 66 cents from 59 cents versus the Wall Street consensus of 63 cents.
Our View in ElliottWave-Forecast.com
When it comes to our BBY’s stock price analysis, Best Buy is still a buy in the dip on the weekly time frame while still missing the minimum target of the 70’s level. The 70’s price target is the equal legs of the (w) – (x) swing since the stock first started trading. The rally since 12/2012 as well seems incomplete. Price took the equal legs at the 56’s zone but RSI yet to show divergence, a fact suggesting we are most likely going to see the next level at the 1.236% extension around the 66’s, just 4$ from the equal legs at 70’s mentioned above.
BBY Best Buy Weekly Elliott Wave Count
At this stage we would like to see price correcting down to the 56’s zone where the supporting trend line since 06/01/16 is holding. From there we expect price to bounce and ideally extend to new highs towards our target or at least create a 3 wave bounce which should provide longs the ability to get Risk Free.
