الأكثر زيارة

 رد مع اقتباس


عروض شركات الفوركس
 |  |  | |  |  |  |

 عضو المتداول العربي
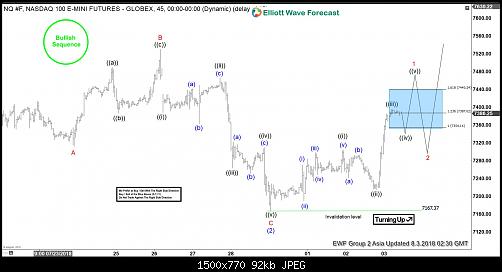
NASDAQ Elliott Wave Analysis: Ready To Rally Higher?
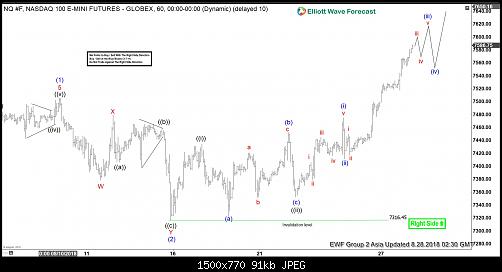
NASDAQ futures: ticker symbol NQ_F short-term Elliott wave analysis suggests that the decline to $7167.37 low ended intermediate wave (2) pullback. The internals of that pullback unfolded as Elliott Wave Flat correction where Minor wave A ended at $7311.50 low. Above from there, the bounce to $7530 high ended Minor wave B bounce as Elliott wave Zigzag where Minute wave ((a)) ended at $7489.75 high, Minute wave ((b)) pullback ended at $7386.75 low and Minute wave ((c)) of B ended at $7530 high.
Down from there, the index declined in 5 waves lower within Minor wave C. The first leg lower Minute wave ((i)) ended at $7388.5. Up from there, the bounce to $7467 high ended Minute wave ((ii)) and then the decline to $7263.50 low ended Minute wave ((iii)). Minute wave ((iv)) bounce ended at $7309.25 and the last leg Minute wave ((v)) of C ended at $7167.37 low. This last leg also completed Intermediate wave (2) pullback. Near-term, while dips remain above $7167.37 low, expect the Index to do a nesting to resume the the next leg higher. A break above $7530 (irregular wave B) however is needed for final confirmation to avoid a double correction lower. We don’t like selling the index.
NASDAQ 1 Hour Elliott Wave Chart
عضو المتداول العربي
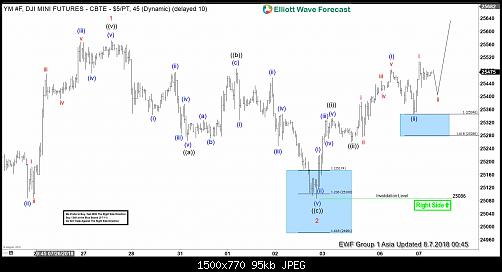
Dow Futures (YM_F) Elliott Wave View: Reacting Higher From Blue box
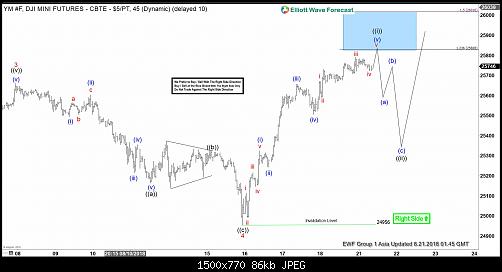
Dow Futures ticker symbol: YM_F short-term Elliott wave view suggests that the rally from 6/28/2018 low cycle to 25572 high on 7/27/2018 peak ended Minor wave 1. The internals of that rally higher took place as an impulse structure with sub-division of 5 waves structure in each leg higher. Down from there, the index corrected the 6/28/2018 cycle in 3 swings pullback & ended Minor wave 2 at 25086 low.
The internals of that pullback unfolded as Elliott wave Zigzag correction with the sub-division of 5-3-5 structure in Minute wave ((a)), ((b)), ((c)). Down from 7/27 peak, the decline to 25264 low ended Minute wave ((a)) in 5 waves structure. From there, the rally to 25486 high ended Minute wave ((b)) and the subsequent move lower to 25086 low ended Minute wave ((c)) of 2 in 5 waves structure. Minor wave 2 ended within the 25174 – 25100 area, which is 100%-123.6% Fibonacci extension of ((a))-((b)), as indicated by the blue box.
Up from 25086, the index is reacting higher in 3 swings so far and longs from blue box area should be risk-free (stop loss at break even) already. The right side tag, combined with the blue box, help to identify the right trading strategy. Near-term, as far as dips remain above 25086 low, the right side of the market remains to the upside. Expect the Index to resume the next extension higher in Minor wave 3, but a break above 25572 high remains to be seen for final confirmation and to avoid double correction lower in Minor wave 2 pullback. We don’t like selling it.
YM_F 1 Hour Elliott Wave Chart
عضو المتداول العربي
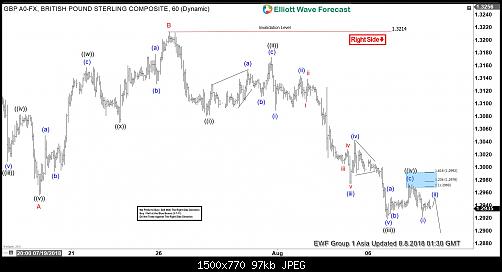
GBPUSD Elliott Wave Analysis: Right Side Calling Lower
GBPUSD short-term Elliott Wave analysis suggests that the decline from 7/09/2018 peak (1.3361) is unfolding as Elliott wave zigzag when Minor wave A ended in 5 waves structure at 1.2956 low. Up from there, the bounce to 1.3214 high ended Minor wave B. The internals of that bounce unfolded as a Double three structure where Minute wave ((w)) ended at $1.3157. Minute wave ((x)) ended at 1.3070 low. And Minute wave ((y)) of B ended at 1.3214 high.
Down from there, Minor wave C remains in progress in another 5 waves. The internals of wave C is unfolding as an impulse & decline to 1.3081 ended Minute wave ((i)) in 5 waves. Up from there, the bounce to 1.3173 high ended Minute wave ((ii)) in 3 waves. Afterwards, pair declined lower in another 5 waves structure with lesser degree cycles showing sub-division of 5 waves structure. And ended Minute wave ((iii)) at 1.2918 low. Above from there, Minute wave ((iv)) is proposed complete at 1.2974 high. At this stage, a break below 1.2919 low remains to be seen for final confirmation and to avoid double correction in Minute wave ((iv)).
Near-term, while bounces fail below 1.2974 high and more importantly the pivot from 1.3214 high stays intact, expect pair to resume lower in Minute wave ((v)) before ending Minor wave C. The minimum extension area for Minute wave ((v)) i.e inverse 1.236%-161.8% Fibonacci extension area of Minute wave ((iv)) comes at 1.2906 – 1.2884. In case of further extension, Minute wave ((v))=((i)) target area can reach 1.2842 – 1.2810 before ending the zigzag structure & a bounce could then take place. We don’t like buying the pair as the right side tag is calling the pair lower.
GBPUSD 1 Hour Elliott Wave Chart
عضو المتداول العربي
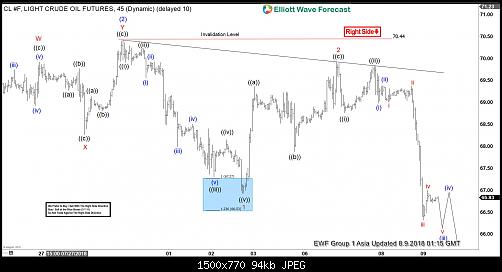
OIL Elliott Wave Analysis: Extending to the Downside
Oil ticker symbol: CL_F short-term Elliott wave analysis suggests that the bounce to $70.44 high ended intermediate wave (2). The internals of that bounce took place as Elliott wave double correction where Minor wave W ended in 3 swings at $69.92. From there, the pullback to $68.26 completed the Minor wave X in 3 swings. Then a bounce higher to $70.44 high ended Minor wave Y in another 3 swings & also completed Intermediate wave (2).
Down from there, the decline is taking place as Elliott wave impulse within intermediate wave (3) lower with the sub-division of 5 waves structure in Minor wave 1, 3 & 5. The initial decline from $70.44 high to $66.92 low ended Minor wave 1 of (3). The lesser degree cycles within that decline also unfolded in 5 waves structure & ended Minute wave ((i)) at $69.91. Minute wave ((ii)) ended at $70.22, Minute wave ((iii)) ended at $67.31 low, Minute wave ((iv)) bounce ended at $68.15 and Minute wave ((v)) of 1 ended at $66.92 low. Above from there, the bounce to $69.92 high ended Minor wave 2.
The internals of Minor wave 2 unfolded in 3 swings as Elliott wave zigzag correction where Minute wave ((a)) ended in 5 waves at $69.36. Minute wave ((b)) ended at $67.87 low and the bounce to $69.92 high ended Minute wave ((c)) of 2. Down from there, Minor wave 3 remain in progress in another 5 waves and as far as bounces fail below $69.92 high and more importantly the pivot from $70.44 high stays intact instrument is expected to see more downside. We don’t like buying it as the right side tag is lower.
OIL 1 Hour Elliott Wave Chart
متداول متميز / مشرف سابق
THX BRO
عضو المتداول العربي
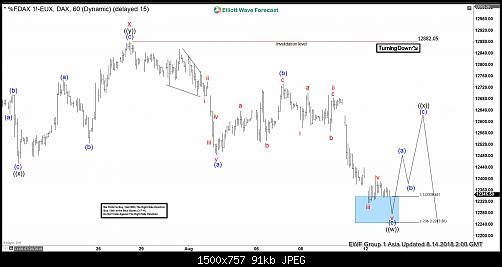
DAX Elliott Wave Analysis: Bounce Can be Temporary
DAX short-term Elliott wave analysis suggests that the rally to 12882.05 high ended Minor wave X bounce. The internals of that bounce unfolded as Elliott wave double three structure where Minute wave ((w)) ended at 12640.87. Minute wave ((x)) ended at 12468.68 and Minute wave ((y)) of X ended at 12882.05 high. Down from there, the decline is showing the overlapping price action suggesting that the decline in Minor wave Y is taking place as 3 wave corrective sequence i.e either ((w)),((x)),((y)) or ((w)),((x)),((y)),((x)),((z)) structure in Minute degree.
The initial decline from 12882.05 high is unfolding as Elliott wave zigzag correction in Minute wave ((w)) lower. Where minutte wave (a) ended in 5 waves structure at 12494 low. Up from there, the bounce to 12740.12 high ended Minutte wave (b) bounce in 3 swings. Decline from there is taking place in another 5 waves structure & reached the 12338.65-12245.56 100%-123.6% Fibonacci extension area of (a)-(b) to end Minutte wave (c) of ((w)). And soon, the index is expected to do a Minute wave ((x)) bounce in 3, 7 or 11 swings against 12882.05 high before further decline in Minute wave ((y)) of Y is seen. We don’t like selling it.
DAX 1 Hour Elliott Wave Chart
عضو المتداول العربي
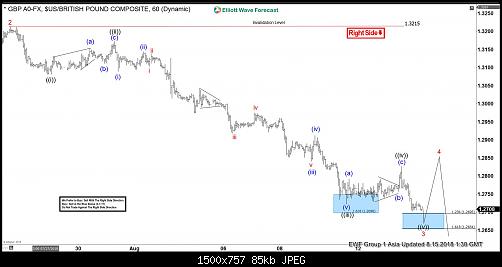
GBPUSD Elliott Wave View: Calling For More Downside
GBPUSD short-term Elliott wave view suggests that the rally to 1.3215 high ended Minor wave 2 bounce. Down from there, Minor wave 3 is taking place as impulse structure with lesser degree cycles are showing sub-division of 5 waves structure lower in it’s each leg lower i.e Minute wave ((i)), ((iii)) & ((v)). While the sub-division in Minute wave ((ii)) & ((iv)) unfolded in 3 wave corrective sequence.
Down from 1.3215 high, the initial decline to 1.3081 low ended Minute wave ((i)) in 5 waves. Up from there, the bounce to 1.3172 high ended Minute wave ((ii)) in 3 swings as Elliott wave zigzag. Below from there, the decline to 1.2722 low unfolded in 5 waves & ended Minute wave ((iii)). Above from there, the bounce to 1.2826 high ended Minute wave ((iv)) in 3 swings as zigzag. Near-term focus remain towards 1.2695-1.2654 inverse 123.6%-161.8% of Minute wave ((iv)) to end Minute wave ((v)) of 3. Afterwards, the pair is expected to do a Minor wave 4 bounce in 3, 7 or 11 swings before further downside is seen. In case of further extension in Minute wave ((v)) of 3, pair can see 61.8%-76.4% Fibonacci extension area of Minute ((i))+((iii)) at 1.2521-1.2448 area as well before bounce in Minor wave 4 takes place. We don’t like buying it and prefer more downside against 1.3215 high in the first degree.
GBPUSD 1 Hour Elliott Wave Chart
عضو المتداول العربي
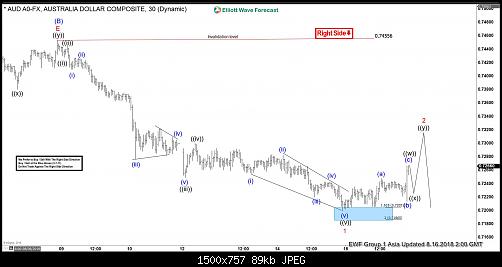
AUDUSD Elliott Wave View: More Downside Is Expected
AUDUSD short-term Elliott wave view suggests that the bounce to 0.7455 high ended intermediate wave (B). Down from there, the pair has broken to new lows confirming the intermediate wave (C) lower. The internals of the decline is unfolding as impulse where Minor wave 1, 3 & 5 are expected to unfold in 5 waves structure. While Minor wave 2 & 4 can be can be any 3 wave corrective pattern i.e either double, triple three etc.
Down from 0.7455 high, Minor wave 1 is proposed complete at 0.7201 low. The internals of that decline showing sub-division of 5 waves structure in lesser degree cycles. Where Minute wave ((i)) ended in 5 waves structure at 0.7431. The Minute wave ((ii)) bounce ended at 0.7445. Then Minute wave ((iii)) ended at 0.7249 low in lesser degree 5 waves structure. Up from there, the bounce to 0.7299 high ended Minute wave ((iv)). Below from there, the decline to 0.7201 low ended Minute wave ((v)) in lesser degree 5 waves structure and also completed Minor wave 1 of (C). Above from there, the pair is doing a Minor wave 2 recovery & expected to fail in 3, 7 or 11 swings as far as a pivot at 0.7455 high stays intact for further downside. We don’t like buying the pair & prefer more downside against 0.7455 high.
AUDUSD 1 Hour Elliott Wave Chart
عضو المتداول العربي
Dow Futures Elliott Wave View: Pullback Should Find Support
Short-term Elliott Wave view on YM_F (Dow Futures) suggests that the pullback to 24956 low ended Minor wave 4. Up from there, Index is rallying within Minor wave 5 to end a 5 waves up from 4/2/2018 low. Minute wave ((i)) of 5 is currently in progress with internal subdivision as an impulse structure, This suggests lesser degree cycles in the direction of trend should unfold in 5 waves structure, i.e Minutte wave (i), (iii) & (v). On the other hand, the sub-division of lesser degree cycles against the trend should unfold in 3 waves corrective sequence, i.e. Minutte wave (ii) & (iv).
Up from 24956, Minutte wave (i) ended at 25326, Minutte wave (ii) ended at 25243, Minutte wave (iii) ended at 25657, Minutte wave (iv) ended at 25506, and Minutte wave (v) remains in progress towards 25828 – 26016. The move higher should also complete Minute wave ((ii)). Index should then pullback in Minute wave ((ii)) to correct cycle from 8/15/2018 low before the rally resumes. We don’t like selling the proposed pullback and expect dips to find support in 3, 7, or 11 swing as far as pivot at 24956 low stays intact.
Dow Futures 1 Hour Elliott Wave Chart
عضو المتداول العربي
Can ROKU Stock price surpass $100? ElliottWave Forecast Analysis
ROKU (NASDAQ:ROKU) a streaming TV platform surged last Thursday more than 20% after the company reported better-than-expected second-quarter results.
The company currently has 22 million active users but still can’t compete with the giant Netflix (NASDAQ:NFLX) having 130 million subscriber. However, ROKU is taking serious steps to expand and not limit the product to Roku devices. It already made the move to put The Roku Channel on all internet-enabled devices.
Since its IPO, the stock price tripled and investors are looking forward for more gains. So let take a look at the daily technical Elliott Wave structure:
ROKU did an impulsive 5 waves advance from 2017 low, followed by a 3 waves pullback that found buyers at equal legs area $32.81 – $28.14 before resuming the rally higher. The stock did manage to make new all time highs so consequently it opened a new bullish sequence to the upside calling for a minimum target at $71.99. However, if we are looking for ROKU to start an impulsive move higher then it should be looking for the 3rd wave to reach / exceed the 1.618 fib ext area coming at $98 area.
ROKU Elliott Wave Daily Chart 8.13.2018
Recap
ROKU stock is showing 2 impulsive structure from 2017 and 2018 lows, therefore as long as pullbacks remain supported above $29 low then it will be looking for a continuation higher with a potential of a break above $100 at a later stage.
عضو المتداول العربي
Thank you my brother, I was amused by your analysis of Charts by the wave theory of Eliotte, and I wished you a good contituation.
عضو المتداول العربي
You are welcomeالمشاركة الأصلية كتبت بواسطة ThomasTRD

عضو المتداول العربي
NASDAQ Elliott Wave Analysis: Nesting Higher As Impulse
NASDAQ ticker symbol: $NQ_F short-term Elliott wave analysis suggests that the rally from 7/30 low ($7167.75) to $7505.25 high ended Intermediate wave (1). The internals of lesser degree cycles within Intermediate wave (1) unfolded as 5 waves impulse structure. Down from there, the correction against that cycle in Intermediate wave (2) pullback is proposed complete at $7316.5 low. The subdivision of Intermediate wave (2) unfolded as double three structure. Where Minor wave W ended at $7378.25. The rally to $7479 high ended Minor wave X. And the decline to $7316.45 low ended Minor wave Y of (2).
Above from there, the NASDAQ has already made a new all-time high confirming the next extension higher in Intermediate wave (3) higher has started. The internals of the rally higher is unfolding as 5 waves impulse structure. Where Minute wave ((i)) ended in 5 waves at $7433.5 high. Then the pullback to $7352 low ended Minute wave ((ii)) pullback as a Flat structure. Up from there, the index is nesting higher in Minute wave ((iii)) with lesser degree cycles showing 5 wave advance. Near-term, as far as a pivot from $7316.45 low remains intact index is expected to see more upside. We don’t like selling it and expect buyers to appear in 3, 7 or 11 swings against $7316.45 low in the first degree.
NASDAQ 1 Hour Elliott Wave Chart
عضو المتداول العربي
S&P500 Mini Futures: Extending Higher As Impulse
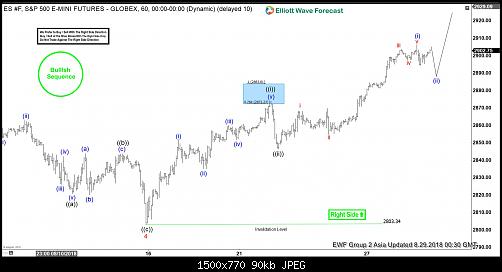
S&P500 Mini Futures ticker symbol: $ES_F short-term Elliott wave view suggests that the decline to $2803.34 low ended Minor wave 4 pullback. The internals of that pullback unfolded as Elliott wave zigzag correction. The lesser degree Minute wave ((a)) ended in 5 waves at $2820.5 low. Then the bounce to $2843.50 high ended Minute wave ((b)) bounce as a Flat correction. Down from there, the index completed the Minute wave ((c)) in another 5 waves at $2803.34 low.
Up from there, the rally higher is taking place as impulse structure with lesser degree cycles showing sub-division of 5 waves structure in each leg higher. It’s also important to note here that index is already into new all-time highs & both the sequence & right side tags are calling index for more upside. Above from $2803.34 low, the minute wave ((i)) ended in lesser degree 5 waves structure at $2874 high. The pullback to $2846.25 low ended Minute wave ((ii)). A rally from there unfolding in another 5 waves structure within Minute wave ((iii)) with lesser degree cycles in Minutte wave (i), (iii) & (v) expected to unfold in 5 waves structure. We don’t like selling the index and expect buyers to appear in 3, 7 or 11 swings against $2803.34 low in the first degree.
S&P500 Mini Futures 1 Hour Elliott Wave Chart
عضو المتداول العربي
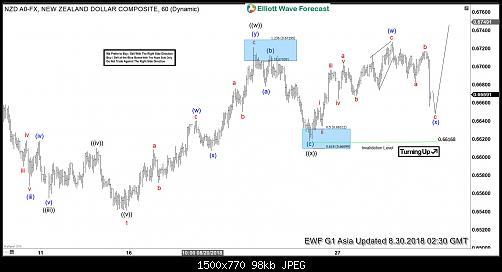
NZDUSD Elliott Wave Analysis: Double Correction Taking Place
NZDUSD short-term elliott wave analysis suggests that the decline to 0.6543 low ended Minor wave 1. The internals of that decline unfolded as impulse structure with lesser degree Minute wave ((i)), ((iii)) & ((v)) unfolded in 5 waves structure. Above from there, Minor wave 2 bounce is taking place as double correction higher with lesser degree cycles showing sub-division of 3 wave structure its each leg higher.
Up from 0.6543 low, the rally to 0.6719 high ended Minute wave ((w)) of 2. The internals of that rally also unfolded as double three structure where Minutte degree wave (w) ended at 0.6639. Minutte wave (x) pullback ended at 0.6609 & Minutte (y) of ((w)) ended at 0.6719 high. From there, the pullback to 0.6616 low ended Minute wave ((x)) of 2 as a Flat structure. Near-term, as far as dips remain above there, expect pair to resume the next leg higher in Minute wave ((y)) of 2 looking for 0.6795-0.6835, which is the 100%-123.6% Fibonacci extension area of Minute wave ((w))-((x)) to end Minor wave 2 bounce. We don’t like buying the pair.
NZDUSD 1 Hour Elliott Wave Chart