الأكثر زيارة

 رد مع اقتباس


عروض شركات الفوركس
 |  |  | |  |  |  |

 عضو المتداول العربي
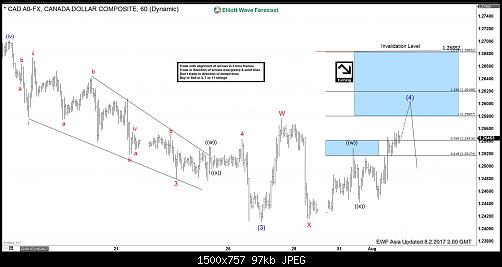
USDCAD Elliott Wave View: Wave (4) in progress
Short term USDCAD Elliott Wave view suggests the decline to 1.2411 ended Intermediate wave (3) of an Elliott Wave impulse structure from 6/2 peak. Intermediate wave (4) bounce is in progress as a double three Elliott wave structure where Minor wave W ended at 1.2576 and Minor wave X ended at 1.2416. Minor wave Y is subdivided also as a double three Elliott Wave structure. Up from 1.2416 low, Minute wave ((w)) ended at 1.253 and Minute wave ((x)) ended at 1.2443. Near term focus is on 1.258 – 1.262 area to complete Intermediate wave (4). Afterwards, pair should either resume to new low or at least pullback in 3 waves. We don’t like buying the proposed bounce.
USDCAD 1 Hour Elliott Wave Chart
متداول متميز / مشرف سابق
شكراً يا كبير ...
إستمر و متابع معاك
عضو المتداول العربي
USDCAD Elliott Wave View: Flat correction
Short term USDCAD Elliott Wave view suggests the decline to 1.2411 ended Intermediate wave (3) of an Elliott Wave impulse structure from 6/2 peak. Intermediate wave (4) bounce is in progress as a flat Elliott wave structure where Minor wave A ended at 1.2576 and Minor wave B ended at 1.2416. Minor wave C is subdivided as an impulse Elliott Wave structure. Up from 1.2416 low, Minute wave ((i)) ended at 1.253, Minute wave ((ii)) ended at 1.2443, Minute wave ((iii)) ended at 1.2593 and Minute wave ((iv)) ended at 1.2355. Near term focus is on 1.262 – 1.2683 to complete Intermediate wave (4) flat. Afterwards, pair should either resume to new low or at least pullback in 3 waves. We don’t like buying the proposed bounce.
USDCAD 1 Hour Elliott Wave Chart
USdCAD 1 hour Aug 3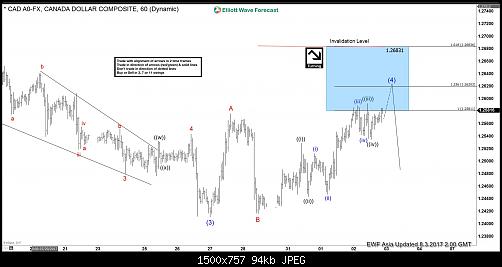
عضو المتداول العربي
EURCAD Selling Opportunity
On June 13/2017 I published an article EURCAD : Sell the Bounce Bearish Pattern where I called for the pair to make another move lower after a bounce/retracement higher. EURCAD since then bounced and continued lower as expected but did not fully close the April 13/2017 market gap as I would have liked it to do. With still a market gap yet to be closed we at ElliottWave-Forecast believe EURCAD will make another push lower and the chart below explains where bears will be waiting to push the pair lower.
EURCAD 4 Hour Chart Bearish Pattern: Traders need to wait for price to hit the BC 0.50% (1.4865) where blue point D can possibly terminate and trigger sells. As long as price stays below the point B high (1.5255) expect EURCAD to continue lower. The area to watch for possible reversal lower is 1.4865 – 1.4920
If looking to sell EURCAD traders should be patient and wait for price to make a move higher towards the BC 0.50% Fib. retracement level at 1.4866. Waiting for price to hit the BC 0.50% Fib. retracement minimum will offer a better risk/reward trade setup. Blue bullish pattern is invalidated if price moves above point B of the pattern.
Of course, like any strategy/technique, there will be times when the strategy/technique fails so proper money/risk management should always be used on every trade.
*** Always use proper risk/money management according to your account size ***
عضو المتداول العربي
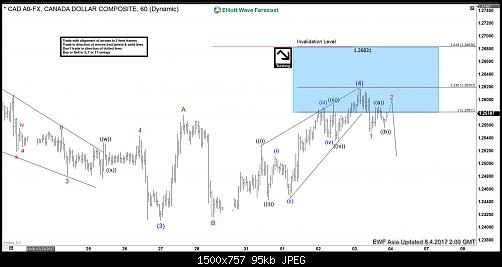
USDCAD Elliott Wave View: Correction Ended
Short term USDCAD Elliott Wave view suggests the decline to 1.2411 ended Intermediate wave (3) of an Elliott Wave impulse structure from 6/2 peak. Intermediate wave (4) bounce is in progress as a flat Elliott wave structure where Minor wave A ended at 1.2576 and Minor wave B ended at 1.2416. Minor wave C is subdivided as an impulse Elliott Wave structure. Up from 1.2416 low, Minute wave ((i)) ended at 1.253 and pullback to 1.2443 ended Minute wave ((ii)). Pair then rallied in Minute wave ((iii)) ending at 1.2593 and Minute wave ((iv)) pullback ended at 1.2355. Near term, Minute wave ((v)) of C is proposed complete at 1.2619, which also complete Intermediate wave (4). While bounces stay below 1.2619, and more importantly below 1.2683, expect pair to extend lower or at least pullback in 3 waves. We don’t like buying the pair.
USDCAD 1 Hour Elliott Wave Chart
عضو المتداول العربي
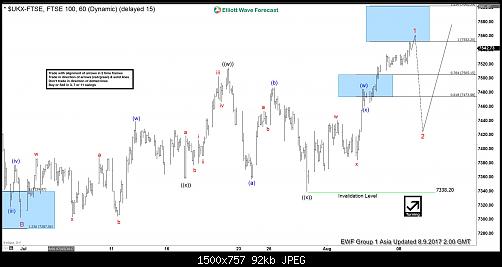
FTSE 100 Elliott Wave View: Pullback expected
Short term FTSE 100 ( UKX-FTSE ) Elliott Wave view suggests that Minor wave B ended on 6/30 low 7302.7 and the rally from there is unfolding as a double three Elliott wave structure where wave ((w)) ended at 7515.12 and wave ((x)) pullback ended at 7338.2. Index has reached 100% from 6/30 low so cycle is mature and Minor wave 1 can be complete anytime. Expect the Index to pullback in Minor wave 2 soon to correct cycle from 6/30 low before the rally resumes. As far as pivot at 7302.7 low remains intact, Index should find buyers within Minor wave 2 dips in the sequence of 3, 7, or 11 swing for further upside. If pivot at 7302.7 low fails during later pullback, the Index would be still remain in the same cycle from 6/2 peak. Index should then extend the correction to the downside. We don’t like selling the Index.
FTSE 1 Hour Elliott Wave Chart
عضو المتداول العربي
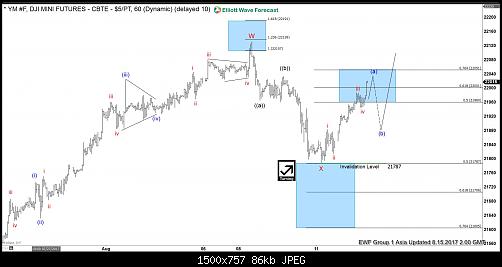
Dow Future Elliott Wave View: Resuming Higher
Short term Dow Futures (YM_F) Elliott Wave view suggests that rally from 6/29 low is unfolding as a a double three Elliott wave structure. Up from 6/29 low (21138), Minor wave W ended at 22132 and pullback to 21790 ended Minor wave X. Rally from there is unfolding as an impulse Elliott wave structure. Up from 21790, Subminutte wave i ended at 21884, Subminutte wave ii ended at 21815, Subminutte wave iii ended at 21988 and Subminutte wave iv ended at 21946. Expect Subminutte wave v of (a) to complete soon and thus cycle from 8/11 low to end. Index should then pullback in Minutte wave (b) to correct cycle from 8/11 low before resuming higher again. We don’t like selling the proposed pullback and expect buyers to appear once Minutte wave (b) pullback is complete in 3, 7, or 11 swing provided pivot at 21787 low stays intact.
Dow Future 1 Hour Elliott Wave Chart
عضو المتداول العربي
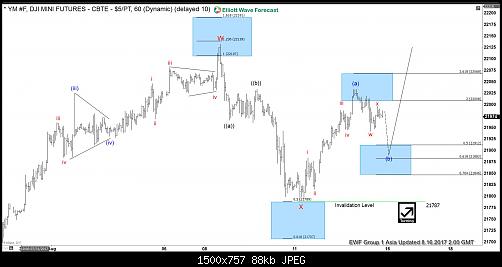
Dow Futures Elliott Wave View: 3 waves pullback
Short term Dow Futures (YM_F) Elliott Wave view suggests that rally from 6/29 low is unfolding as a a double three Elliott wave structure. Up from 6/29 low (21138), Minor wave W ended at 22132 and pullback to 21790 ended Minor wave X. Rally from there is unfolding as an impulse Elliott wave structure. Up from 21790, Subminutte wave i ended at 21884, Subminutte wave ii ended at 21815, Subminutte wave iii ended at 21988, Subminutte wave iv ended at 21946, and Subminutte wave v of (a) ended at 22034. Minutte wave (b) is in progress to correct cycle from 8/11 low in 3, 7, or 11 swing before the Index resumes the rally. We don’t like selling the proposed pullback and expect buyers to appear once Minutte wave (b) pullback is complete in 3, 7, or 11 swing provided pivot at 21787 low stays intact.
عضو المتداول العربي
Thanks for your hard work
عضو المتداول العربي
You are welcomeالمشاركة الأصلية كتبت بواسطة adil555m

عضو المتداول العربي
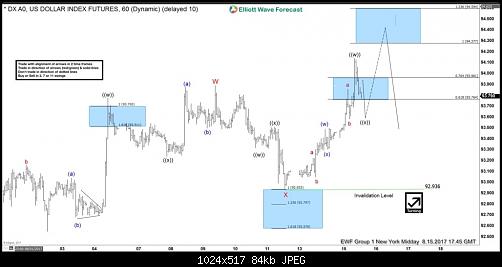
USDX Elliott wave view: Double three
Short term USDX index Elliott Wave view suggests that the decline to 8/02 (92.54) low ended intermediate wave (3) then the rally from there is unfolding as a a double three Elliott wave structure. As the structure from the 8/02 looks to be overlapping, hence suggesting it’s corrective structure, either W,X,Y or W,X,Y,Z.
Where the first leg higher ended in Minor wave W at 93.77 & pullback to 92.93 low ended Minor wave X. Minor wave Y currently in progress as double three structure , where Minute wave ((w)) ended at today’s peak 94.04. And while near term dips remains above 92.93 low index has scope to extend 1 more push higher towards 94.27-94.59 100%-123.6% fibonacci extension area to end the cycle from 8/02 lows in intermediate wave (4) bounce then index has scope to resume the decline or should do a 3 waves pullback at least ( if it continues to extend higher later on as W,X,Y,Z). However we don’t like buying the index and expect seller’s to appear again in between 94.27-94.59 area for more downside or for 3 waves pullback at least.
USDX 1 Hour Elliott Wave Chart
عضو المتداول العربي
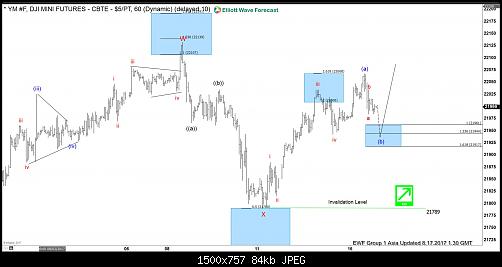
Dow Futures Elliott Wave View 8.17.2017
Short term Dow Futures (YM_F) Elliott Wave view suggests that rally from 6/29 low is unfolding as a a double three Elliott wave structure. Up from 6/29 low (21138), Minor wave W ended at 22132 and pullback to 21790 ended Minor wave X. Rally from there is unfolding as an impulse Elliott wave structure. Up from 21790, Subminutte wave i ended at 21884, Subminutte wave ii ended at 21815, Subminutte wave iii ended at 22034, Subminutte wave iv ended at 21942, and Subminutte wave v of (a) ended at 22067. Minutte wave (b) is in progress to correct cycle from 8/11 low in 3, 7, or 11 swing before the Index resumes the rally. We don’t like selling the proposed pullback and expect buyers to appear once Minutte wave (b) pullback is complete in 3, 7, or 11 swing provided pivot at 21787 low stays intact.
Dow Futures 1 Hour Elliott Wave Chart
متداول متميز / مشرف سابق
thank you bro ... keep going
عضو المتداول العربي
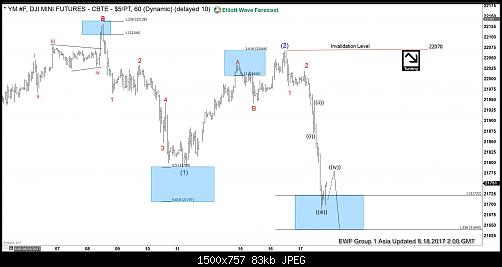
Dow Futures Elliott Wave view 8.18.2017
Short term Dow Futures (YM_F) Elliott wave view suggest that the rally to 8/08 peak 22177 ended the “Cycle” from Feb 11, 2016 low. The decline from there is unfolding as an impulse suggesting the index could be following a Elliott Wave Zigzag pattern in larger degree correction. From there Intermediate wave (1) ended at 21789 in 5 waves at 21789 low and bounce from there ended in 3 swings at 22070 peak as another zigzag pattern within intermediate wave (2).
The decline from there is unfolding as an impulse Elliott wave structure within intermediate wave (3). Below from 21789 peak, Minor wave 1 ended at 21993, Minor wave 2 ended at 22034 peak. Below from there Minute wave ((i)) ended at 21885, Minute wave ((ii)) ended at 21950, Minute wave ((iii)) ended at 21705 low and above from there doing a Minute wave ((iv)) bounce. Which is expected to unfold in 3 swings and shouldn't pass the 0.382% Fibonacci retracement area 21798 of Minute wave ((iii)) for the idea to remain alive for further downside in Minute wave ((v)) of 3 lower initially. We don’t like selling the pullback and expect further downside extension as far as pivot from 22070 peak & more importantly from 22177 peak remains intact to continue correction lower.
Dow Futures 1 Hour Elliott Wave Chart
عضو المتداول العربي
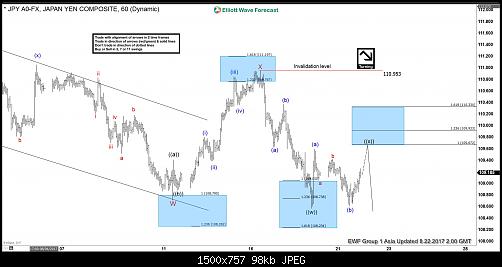
USDJPY Elliott Wave View: Ending bounce
Short term USDJPY Elliott wave view suggest that the decline from 7/11 peak is unfolding as a double three Elliott wave structure. Decline to 108.71 low ended Minor wave W and correction of that cycle ended in a Minor wave X at 110.95 peak. Subdivision of Minor wave Y is unfolding as a Zigzag structure. Minute wave ((w)) of ((Y) ended at 108.59 low and Minute wave ((x)) of (Y) bounce is in progress as another Zigzag structure.
Up from 108.59 wave ((w)) low, Minutte wave (a) of ((x)) ended at 109.6 peak and Minutte wave (b) of ((x)) pullback ended at 108.609. Above from there, Minutte wave (c) of ((x)) is in progress towards 109.67-109.92 or 100%-123.6% Fibonacci extension area of (a)-(b). Afterwards, pair should resume the decline or pullback in 3 swings at least. We don’t advise buying the pair into the bounce. Expect sellers to appear after Minute wave ((x)) bounce is complete in 3, 7 or 11 swings for further downside, provided pivot at 110.95 peak stays intact.
1 Hour USDJPY Elliott Wave Chart