

 الأكثر زيارة
 رد مع اقتباس


عروض شركات الفوركس
 |  |  |  | |  |  |  |

 عضو نشيط
ياعزائي الوزن يختلف عن الكتله لان الكتله هي التعبير لثقل الاشياء مثلا وزن هذه السياره 2000 kg لاتقال وزنها بل يقال كتلتها يجب تصحيح المفاهيم لابد من ذلك
عضو المتداول العربي
المشاركة الأصلية كتبت بواسطة omri_fadwah_lakk

عطارد ونبتون
ويا ترى المعادلة عملت حساب بلوتو ولا معدش ينفع ما خرج من الكواكب وبقه جسيم
كل التعقيدات دى بتفكرنى بـ "ودنك منين يا جحا"
الفوركس سهل وكل ما تزيد التعقيدات هتزيد الخساير
المعادلات دى متنفعش غير فى سوق مستقر وبتحكمه قوى العرض والطلب
مش قوى الحيتان والهوامير والمصالح الشخصية
عضو المتداول العربي
عضو المتداول العربي
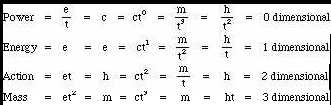
We can describe the same hierarchy another way by borrowing the concepts of time as the fourth dimension (from Einstein and Minkowski), and imaginary time (i.e., the square root of a negative number, as suggested by Hawking in Black Holes and Baby Universes, p. 82).
(13.1)
(13.2)
(13.3)
(13.4)
(13.5)
By this method, c = t. That is, the first and fifth powers are equivalent, setting up the circular, bounded universe suggested by Hawking. The entire system now becomes (13.6)
In other words, 90° times 4 dimensions equals a 360° circle, where c equals t, which equals minus the square root of minus 1, via c*t4 = t = c*1 = c
آخر تعديل بواسطة omri_fadwah_lakk ، 27-06-2010 الساعة 03:49 PM
عضو المتداول العربي
We will take as our lambdamin the Compton wavelength of the proton. (Even hypothetically smaller units, such as the distance between quarks, are related to this proton size.) From the CODATA tables (Nat'l Bureau of Standards), we find the Compton wavelength to be 1.32141 x 10⁻¹³ cm. Therefore, there are 1/1.32141 x 10-13 lambdamin's in a centimeter. Let us now substitute a value for lambdamin. We have seen in equation (10.1) that lambda = e, which implies that lambda = -1 (from equation (13.2)), i.e., distance is negative. Although this raises some conceptual difficulties which will be discussed later, we will follow the logic of the minimalist, or quantum, approach. Leaving aside for the moment the difficulty of thinking of distances as negative, we have the following:
(15.1)
Solving for cm., we get the following:
(15.2)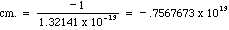
Having substituted a number (-1) for the unit of distance (lambda), the result is a unitless number. Bearing in mind that we are dealing with the minimum values in nature, we may (by way of transition) think of the result as a quantity of quanta -- in this case, a quantity of negative quanta.
16. Staying with our proton model, we can take mmin to be the mass of the proton, which is 1.6726231 x 10⁻²⁴ grams. We have seen that mmin is equal to +1 (equation (13.4)). Accordingly:
(16.1)
Solving for gm., we get the following:
(16.2)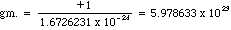
17. We will take the tmin to be the time it takes for light to travel the diameter of a proton, which will be the Compton wavelength divided by the speed of light.
(17.1)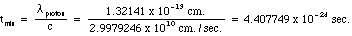
Solving for sec., we get the following: (17.2)
عضو المتداول العربي
. A wavelength (lambda) is a measure of length, or distance, i.e., the distance between two "crests" of a wave. Taking the hypothesis that there exists some natural minimum unit of length, we will further hypothesize that such a minimum would constrain the value of the wavelength, such that the minimum wavelength would be equal to the minimum distance. We define this minimum distance, and, therefore, this minimum wavelength, as having a value of 1, the "unit of distance". (Actually, as we will see later, we are speaking of the absolute value of lambdamin; for now, we will simply set the value to 1.)
(1.1)
2. Rate, or velocity (such as the speed of light), multiplied by time equals distance:
(2.1)
From this, we derive:
(2.2)
and
(2.3)
Because we postulate that there is a minimum distance, there must be a solution to equation (2.1) such that
(2.4)
Thus:
(2.4.1)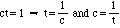
(2.4.2)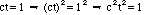
(2.4.3)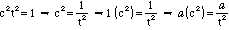
where "a" represents any number.
3. The speed of light (c) is constant; it is, therefore, both a maximum and a minimum. The t in ct = lambdamin (equation (2.4)) will have a minimum value when the minimum distance (lambdamin) is divided by the maximum velocity (c). Thus: (3.1)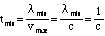
عضو المتداول العربي
فكر بزاويه
51.89
ما\ا يحدث عندها
عضو المتداول العربي
عضو المتداول العربي
عضو المتداول العربي
الجدول 2 : فيبوناتشي وفترةastreنجمة
période en années (1)الفترة في السنوات (1)
suite de Fibonacciفيبوناتشي
période calculée en années (2)فترة محسوبة في السنوات (2)
écarts (3)ثغرات (3)
Soleilشمس
0.0739 (4)0.0739 (4)
11
0.06690.0669
9.5%9.5 ٪
Luneقمر
0.0748 (5)0.0748 (5)
11
0.06690.0669
10.6%10.6 ٪
Mercureزئبق
0.2410241
22
0.26780.2678
-11.1%-11.1 ٪
Vénusفينوس
0.6150615
33
0.60250.6025
2%2 ٪
Terreأرض
11
"4" (6)"4" (6)
1.0711071
-7.1%-7.1 ٪
Marsالمريخ
1.8811881
55
1.6741674
11%11 ٪
Cérèsسيريس
4.604.60
88
4.2844284
6.9%6.9 ٪
Jupiterكوكب المشتري
11.8611.86
1313
11.31311313
4.6%4.6 ٪
Saturneزحل
29.4629.46
2121
29.52229522
-0.2%-0.2 ٪
Uranusأورانوس
8484
3434
77.3977.39
7.9%7.9 ٪
Neptune et Plutonنبتون وبلوتو
206.4 (7)206.4 (7)
5555
202.50202.50
1.9%1.9 ٪
عضو المتداول العربي
سؤال للأستاذ ماركوف
عل طريقتط في المتاجرة تعتمد قي اساسها على
Thermoeconomics
عضو المتداول العربي
اعتقد ان معامل الانحسار والتمدد هوKhinchin-Lévy Constant
عضو المتداول العربي
INTRODUCTION
The
Fibonacci Time Spiral technique is based on the principle of a series of expanding Fibonacci
relationships between
turning points in the market. In order that even those completely
unfamiliar
with Fibonacci can completely understand this concept we will start with a review of
the
basics.
The
Fibonacci or Golden Section Ratio simply refers to the division of space in a ratio of ,618
and .382.
See the illustrations below.
In
the above diagrams one can calculate point C, given points A and B. As well one can
calculate point
2, given points X and Y. To do this you need only know the multipliers which
produce
a Fibonacci division. These multipliers are;
and
Hence
we can test for Fibonacci relationships such as the one in the chart below in 2 ways. The
first is
by multiplying distance A to C by .618 and ,382 to see if another trend change p i n t
occurred
in between which would constitute a Fibonacci relationship. The second is to multiply
the
distance between points A and B by 1.6 18 and 2.6 18 to see if another trend change occurred
at
the projected point counting back. Either nf these 2 methodologies would uncover the same
Fibonacci
relationship in the data.
Given A,
B, and C are known. Trst tu
find
e Fibonacci rcla~ionship by eithrr;
1.
(A to C) (.382) (A to C) * (.blR)
or
2.
(A to^)+(^ 68) snd (AIOB)* (261x1 e
I
1
I
C
I
0
In
attempting to find these relationships in charts we start with the most recent trading bar.
Hence
we are always looking backwards from the current bar. Therefore to start to test for a
potential
trend change point the current bar must be a readily evident high or low. Most times
you
try this exercise you will Q get a Fibonacci relationship to unfold. However when you do,
you
can then begin to look for the potential Fibonacci Spiral.
CALCULATING
THE SPIRAL
Once
you have found the first relationship, by the trial and error method described, beginning
to
construct the Fibonacci Spiral is easy. In the example below, let's assume you have already
calculated
that the sequence of points A-B-C are in a Fibonacci relationship.
The next
step is to simply multiply tne total distance from A to C by the Fibonacci multipliers
of
1.61 8 and 2.618. If either of these project4 points hits another high or low, then you have
another Fibonacci
relationship, and the second ring in the spiral. In the example we will call this
point
D.
As
you might have figured out by now the next step is to simply multiply the distance from
points
A to l) by the Fibonacci multiples of 1.61 8 and 2.618. Again look to see if one of these
projected
points hits a high or low trend change point. If one does hit, then you have the next
point,
and the third ring, in the Fibonacci Spiral!
The
Fibonacci Spiral works on any time frame. On intraday charts allow a little more room for
emor
(2 or 3 bars). On daily and weekly charts plus or minus 1 day margin for error is usually
good,
but this may be expanded as the length of time gets greater. The charts following this text
show a step by step progression of the Fibonacci Spiral in the daily T-Bond market
هذ الكتاب راح يوضح العلاقه بين الفيوناشي وجان والدوامه ارجو تقراوه لاننا بدينا نحمع فصول الحكايه
TurningPoint Analysis
InPrice And Time
16Precise Methods Anticipate
Market Turns And Pinpoint
Highs And Lows
writtenby
Joseph T. Duffy
آخر تعديل بواسطة omri_fadwah_lakk ، 25-07-2010 الساعة 05:41 PM
عضو المتداول العربي
ارجوا قراءه الكتاب لانه راح يجمعلك فصول الحكايه وشكرا للاخ 3ammry
TurningPoint Analysis
InPrice And Time
16Precise Methods Anticipate
Market Turns And Pinpoint
Highs And Lows
writtenby
Joseph T. Duffy
عضو المتداول العربي
الرقم واحد العجيب
2*0.5 =1
1.618*0.618=1
0.236*4.236=1
0.764*1.309=1
