

 الأكثر زيارة

 رد مع اقتباس


عروض شركات الفوركس
 | |  | |  |  |  |

 عضو المتداول العربي
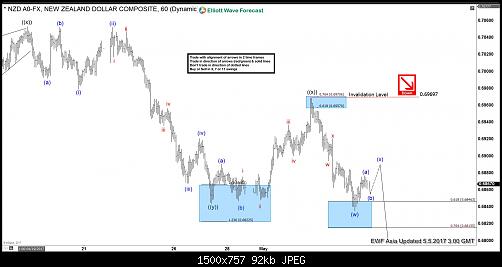
NZDUSD Elliott Wave View: Downside Resumes
Revised Elliott Wave view in NZDUSD suggests the decline from 3/21 high (0.709) is unfolding as a triple three Elliott Wave structure where Minute wave ((w)) ended at 0.6905, Minute wave ((x)) ended at 0.7053, Minute wave ((y)) ended at 0.6844 and Minute second wave ((x)) is proposed complete at 0.6968. Minute wave ((z)) is in progress and unfolding as a double three Elliott Wave structure where Minutte wave (w) ended at 0.6835 , and Minutte wave (x) is in progress to correct cycle from 5/2 high before pair resumes lower again. We don’t like buying the pair and expect bounces in Minutte wave (x) to find sellers in 3, 7, or 11 swing for more downside provided that pivot at 0.6968 high remains intact.
NZDUSD 1 Hour Elliott Wave Chart 05/05/2017
عضو المتداول العربي
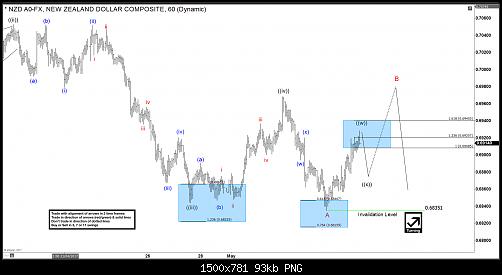
NZDUSD Elliott Wave View: Extended Correction
Revised Elliott Wave view in NZDUSD suggests the decline from 3/21 high (0.709) is unfolding as a leading diagonal Elliott Wave structure where Minute wave ((i)) ended at 0.6905, Minute wave ((ii)) ended at 0.7053, Minute wave ((iii)) ended at 0.6844, Minute wave ((iv)) ended at 0.6968. and Minute wave ((v)) of A ended at 0.6835. Pair is bouncing within Minor wave B to correct cycle from 3/21 high before the decline resumes. We don’t like buying the proposed bounce and expect sellers to appear once wave X bounce is complete in 3, 7, or 11 swing provided that pivot at 3/21 high (0.709) remains intact.
NZDUSD 1 Hour Elliott Wave Chart
عضو نشيط
نسئل الله السلامة للتحليلات ههههههههههههههههههههههومن يتبع هذة الشركة
عضو المتداول العربي
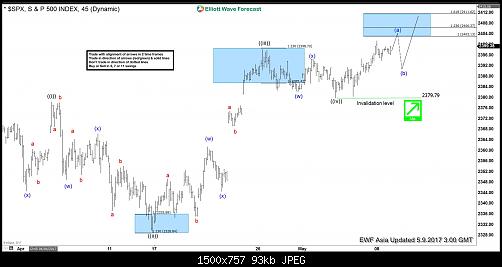
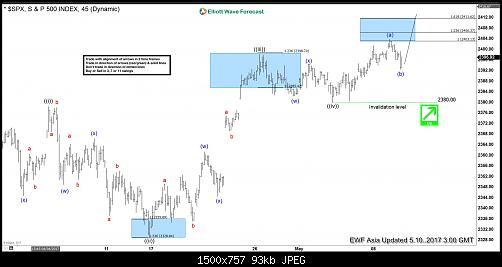
SPX Elliott Wave View: Ending diagonal
Short Term Elliott Wave view in SPX suggests the rally from 3/27 low (2322.2) is unfolding as a leading diagonal Elliott Wave structure where Minute wave ((i)) ended at 2378.36, Minute wave ((ii)) ended at 2328.95, Minute wave ((iii)) ended at 2398.16, and Minute wave ((iv)) ended at 2379.75. The Index has broken above previous Minute wave ((iii)) and thus it has met the minimum requirement in the number of swing to end cycle from 3/27 low as a diagonal. However, while near term pullbacks stay bove 2379, further upside still can’t be ruled out before cycle from 3/27 low ends. Near term focus is on 2403 – 2406 area to complete Minutte wave (a), then Index should pullback in Minutte wave (b) in 3, 7, or 11 swing to correct cycle from 5/3 low before Index resumes higher. We don’t like selling the Index.
SPX 1 Hour Elliott Wave Chart 05/09/2017
عضو المتداول العربي
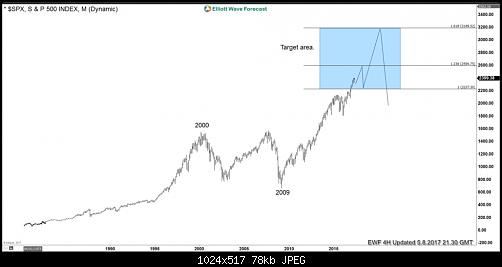
How Bullish is the SPX, Can it see 3189 area?
This is Elliott Wave analysis on SPX and DJUSRE (Dow Jones Real Estate Index) in which we are going to take a look if SPX can reach the 3189 area to the upside before ending the all time cycle. In order to answer it, we will look for a clue in the market by analyzing DJUSRE. The DJUSRE (Dow Jones Real Estate Index) is following similar cycles with the world indices, but correlating DJUSRE with SPX and other world indices, DJUSRE is lagging and hasn’t broken the 2007 peak yet. If the Real Estate Index manages to break above 2007 peak, it will show incomplete bullish sequence and can eventually see 454- 541 area to the upside. That area in DJUSRE then can allow SPX to see the 3189 area next before ending the cycle from 2009 lows and index should correct the all time cycle.
DJUSRE Long Term Elliott Wave View
SPX Long Term Elliott Wave Chart
عضو المتداول العربي
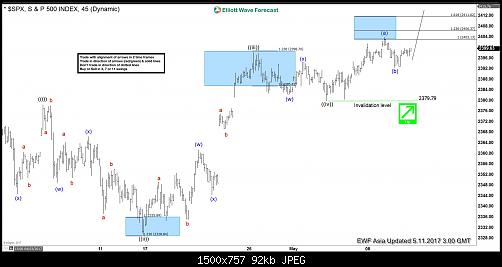
SPX Elliott Wave View: Mature Cycle
Short Term Elliott Wave view in SPX suggests the rally from 3/27 low (2322.2) is unfolding as a leading diagonal Elliott Wave structure where Minute wave ((i)) ended at 2378.36, Minute wave ((ii)) ended at 2328.95, Minute wave ((iii)) ended at 2398.16, and Minute wave ((iv)) ended at 2379.75. The Index has broken above previous Minute wave ((iii)) and thus it has met the minimum requirement in the number of swing to end cycle from 3/27 low as a leading diagonal. However, while near term pullbacks stay above 2380, further upside in one more leg still can’t be ruled out before cycle from 3/27 low ends. Near term, Minute wave (v) is proposed to be unfolding as a zigzag Elliott Wave structure where Minutte wave (a) ended at 2403.8 and Minutte wave (b) ended at 2392.4. While pullbacks stay above 2392.4, and more importantly above 2380, Index has scope to extend one more leg higher. We don’t like selling the Index.
SPX 1 Hour Elliott Wave Chart 05/10/2017
عضو المتداول العربي
SPX Elliott Wave View: Near Pullback
Short Term Elliott Wave view in SPX suggests the rally from 3/27 low (2322.2) is unfolding as a leading diagonal Elliott Wave structure where Minute wave ((i)) ended at 2378.36, Minute wave ((ii)) ended at 2328.95, Minute wave ((iii)) ended at 2398.16, and Minute wave ((iv)) ended at 2379.75. The Index has broken above previous Minute wave ((iii)) and thus it has met the minimum requirement in the number of swing to end cycle from 3/27 low as a leading diagonal. Although the cycle from 3/27 low is already mature, another leg higher can’t be ruled out as far as pullbacks stay above 2380. Near term, Minute wave (v) is proposed to be unfolding as a zigzag Elliott Wave structure where Minutte wave (a) ended at 2403.8 and Minutte wave (b) ended at 2392.4. While pullbacks stay above 2392.4, and more importantly above 2380, Index has scope to extend one more leg higher. We don’t like selling the Index and chasing the last leg higher here is also a bit risky. Expect cycle from 3/27 low to end soon with or without one more leg higher and Index to do larger degree pullback in 3, 7, or 11 swing to correct cycle from 3/27 low before the rally resumes.
SPX 1 Hour Elliott Wave Chart 05/11/2017
عضو المتداول العربي
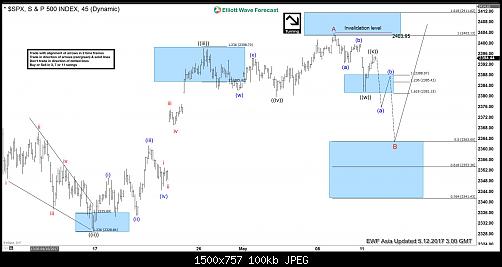
SPX Elliott Wave View: Pull back started
Short Term Elliott Wave view in SPX suggests the rally from 3/27 low (2322.2) ended at 2403 as a leading diagonal Elliott Wave structure where Minute wave ((i)) ended at 2378.3, Minute wave ((ii)) ended at 2328.95, Minute wave ((iii)) ended at 2398.16, Minute wave ((iv)) ended at 2379.75, and Minute wave ((v)) of A ended at 2403. Near term, while bounces remain below there expect the Index to pull back in larger degree 3, 7, or 11 swings to correct cycle from 3/27 low before the rally resumes again. We don’t like selling the Index and expect buyers to appear after 7 or 11 swings pull back for extension higher. This view remains valid as far as pivot at 3/27 (2322.2) low remains intact.
SPX 1 Hour Elliott Wave Chart 05/12/2017
عضو المتداول العربي
Macron’s Triumph Removes Eurozone Political Risk
Emmanuel Macron won the presidential election last Sunday, defeating Marine Le Pen, a far-right nationalist who wanted to take France out of the European Union. Markets had feared that Le Pen’s win could threaten the EU project, but Macron’s win has eliminated uncertainty regarding France’s membership of the Euro and removed the risk of near-term severe political shock to France and wider Europe. The Euro went above $1.10 briefly, but since then has pulled back. The upwards move was not dramatic than the first round of French elections as many traders have anticipated Macron’s victory and thus victory was already well priced in.
The new president has promised economic reforms to restore France’s competitiveness, but Macron currently only has a newly formed minor party and it’s unclear how much support he will get given at least half of its parliamentary candidates will have no prior political affiliations. Thus, the market has now turned its attention to the next legislative election in June. Macron needs to get majority in the National Assembly, otherwise the Prime Minister who exercises the main executive authority, could be a part of the opposition and may ignore his program. It’s crucial for Macron to succeed in parliamentary elections next month in order to enact his reforms.
Macron’s task won’t be easy as he is going to assume a presidency of a nation that is still very divided. One third of French people who voted preferring Le Pen and populism, and over a quarter of French people abstained in the voting. This is one of the highest abstention rates in the history of France and for the first time in the history of France, the election didn't have candidate from the main parties of the left and right. If Macron falls short of a majority in the June’s legislative election, he would need to form a governing coalition with other parties. And if another party wins a majority, then he needs to deal with the rival party during periods called cohabitation.
Macron election absentee
With France’s traditional party system losing confidence by the voters, the risks of cohabitation and political dysfunction have increased. If an opposition party won the majority in National Assembly, Macron will likely be unable to carry out his ambitious political reform. During cohabitation period, normally the president will have a diminished role, and the Premier (Prime Minister) is the one who exercise main executive policy making authority. If, on the other hand, Macron’s party secures parliamentary majority, Macron’s presidency will be smooth and he will be able to implement his agendas.
Despite the uncertainty in the coming June ‘s legislative election, the triumph of Macron is still important as it has removed the worst case scenario for the short term, and this may provide some sort of floor to Euro dollar weaknesses.
EURJPY Long Term Elliott Wave View
Daily chart of EURJPY is showing a 5 swing sequence from 7.8.2016 low, suggesting that as far as pair stays above swing #4 (115.19), it has scope to extend higher. How does this impact the more popular EURUSD? We can look at the correlation between the two pairs below
Overlay of EURJPY and EURUSD
An overlay of EURJPY and EURUSD chart above shows that the move in the two pairs could have a different degree of strength in certain period. For instance, the move during the period of 2015 – 2017 in EURJPY did not create a new low below 2012 low while the move in EURUSD in the same period produced a new low. Despite the different degree of strength, the two pairs still share remarkable similar oscillation and if one pair is trending higher, the other one is likely also moving in the same direction and vice versa. We have seen in the first chart that EURJPY has a bullish sequence from 6.24.2017 low and thus the pair can see an extension higher. Based on the correlation chart above, we may conclude that EURUSD should not see a lot of weaknesses if EURJPY is expected to continue to the upside in 7 swing.
عضو المتداول العربي
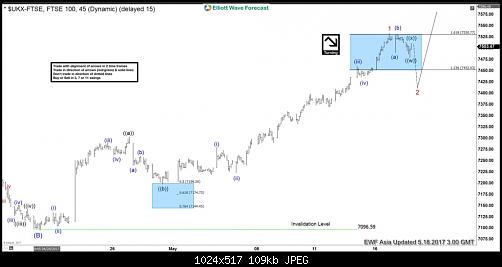
FTSE Index Elliott Wave View: Ending A Cycle
Short Term Elliott Wave view in FTSE Index suggests the rally from 4/20 low (7096.6) is unfolding as a zigzag Elliott Wave structure where Minute wave ((a)) ended at 7302.57 and Minute wave ((b)) ended at 7197.28. Subdivision of Minute wave ((a)) is unfolding as an impulse where Minuttte wave (i) ended at 7134.53, Minutte wave (ii) ended at 7104.22, Minutte wave (iii) ended at 7290.82, Minutte wave (iv) ended at 7262.32, and Minutte wave (v) of ((a)) ended at 7302.57. FTSE Index has since broken above 7302.57 suggesting Minute wave ((c)) has started.
Minute wave ((c)) is currently in progress as an ending diagonal where Minutte wave (i) ended at 7280.7, Minutte wave (ii) ended at 7222.81, Minutte wave (iii) ended at 7460.20, and Minutte wave (iv) ended at 7435.64. Index has reached 1.618 extension of the Minute ((a)) – ((b)) and thus cycle from 4/20 low is mature and Minor wave 1 can be called completed at 7533.7. Expect FTSE Index to correct cycle from 4/20 low soon within Minor wave 2 in 3, 7, or 11 swing before the rally resumes. We don’t like selling the proposed pullback and expect buyers to appear again when Minor wave 2 pullback is over in 3, 7, or 11 swing.
If the Index does not do a decent pullback from here to correct cycle from 4/20 low, then the move from 4/20 low could be instead labelled as a regular 5 waves Impulse Elliott Wave structure in which case we are ending Minor wave 3 at recent high (7533.7) and the Index will do shallow pullback in Minor wave 4 and then extend higher again in Minor wave 5 before ending cycle from 4/20 low and see larger pullback. In both cases, we don’t like selling the Index and expect buyers to appear in the dips in 3, 7 or 11 swings.
FTSE Index 1 Hour Elliott Wave Chart 05/17/5017
عضو المتداول العربي
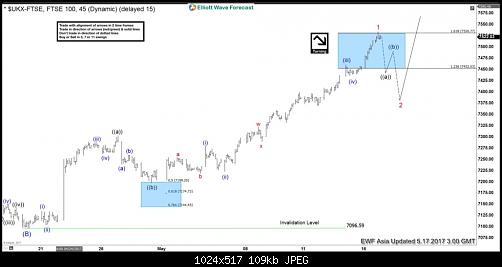
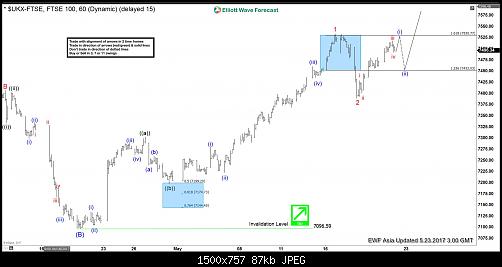
FTSE 100 Elliott Wave View: Turning Lower
Short Term Elliott Wave view in FTSE 100 suggests the rally from 4/20 low (7096.6) is unfolding as a zigzag Elliott Wave structure where Minute wave ((a)) ended at 7302.57 and Minute wave ((b)) ended at 7197.28. Subdivision of Minute wave ((a)) is unfolding as an impulse where Minuttte wave (i) ended at 7134.53, Minutte wave (ii) ended at 7104.22, Minutte wave (iii) ended at 7290.82, Minutte wave (iv) ended at 7262.32, and Minutte wave (v) of ((a)) ended at 7302.57. FTSE 100 has since broken above 7302.57 suggesting Minute wave ((c)) has started.
Minute wave ((c)) is unfolding as an ending diagonal where Minutte wave (i) ended at 7280.7, Minutte wave (ii) ended at 7222.81, Minutte wave (iii) ended at 7460.20, and Minutte wave (iv) ended at 7435.64. Index has reached 1.618 extension of the Minute ((a)) – ((b)) and thus cycle from 4/20 low is mature and we are calling Minor wave 1 completed at 7533.7. Expect FTSE 100 to correct cycle from 4/20 low within Minor wave 2 in 3, 7, or 11 swing before the rally resumes. We don’t like selling the proposed pullback and expect buyers to appear again when Minor wave 2 pullback is over in 3, 7, or 11 swing.
If the Index does not do a decent pullback from here to correct cycle from 4/20 low, then the move from 4/20 low could be labelled as a regular 5 waves Impulse Elliott Wave structure in which case we are ending Minor wave 3 at recent high (7533.7) and the Index will do shallow pullback in Minor wave 4 and then extend higher again in Minor wave 5 before ending cycle from 4/20 low and see larger pullback. In both cases, we don’t like selling the Index and expect buyers to appear in the dips in 3, 7 or 11 swings.
FTSE 100 1 Hour Elliott Wave Chart 05/18/2017
عضو المتداول العربي
Alibaba Stock ( BABA ) Looking for a Pullback
Alibaba Group Holding Limited (NYSE: BABA) is a Chinese e-commerce company that provides sales services via web portals. It also provides electronic payment services, a shopping search engine and data-centric cloud computing services. Alibaba is one of the largest Internet companies as its online sales & profits surpassed all US retailers (including Walmart, Amazon and eBay) combined in 2015 and it now considered as the world’s largest retailer surpassing Walmart.
Alibaba Shares recently managed to make new all time highs after breaking above 2014 peak $120 and investors are still looking for more gains to come. Let’s jump into the Elliott Wave technical analysis to see how bullish is it ?
BABA Double Three Structure
Since 2015 low, BABA started trading in 3 waves move to the upside which currently is forming 5 swings sequence with divergence which we consider as an incomplete bullish sequence as part of a double three structure. So according to the swing structure , the stock is ending the 5th swing around equal legs area $120 – $125 from December 2016 low and it should then pullback in 3 waves against 86.01 low. The 6th swing pullback should ideally hold above the bullish channel to be able to resume the rally toward equal legs area $138 from September 2015.
BABA Leading Diagonal Structure
The second scenario for BABA would be represented when the pivot at $86.01 low gives up later on, which will mean the stock has ended the cycle from from September 2015 low and in that case it can be counted as a leading diagonal because it has 5 corrective waves holding the divergence. Consequently , the correction can extend toward $90 area and take longer time before the stock resume the move to the upside.
Recap:
Alibaba Shares ( BABA ) has a daily bullish structure suggesting more upside in the future. However currently the stock has reached the extreme area $120 – $125 from December 2016 low so no matter which scenario will play out there will be a 3 waves pullback before buyers starts showing up again. Depending on the speed & structure of the correction we’ll know exactly which cycle has ended and where & when will be the ideal area to look for buying opportunities.
عضو المتداول العربي
FTSE Elliott Wave View: Extending Higher
Short Term Elliott Wave view in FTSE suggests the rally from 4/20 low (7096.6) is unfolding as a zigzag Elliott Wave structure where Minute wave ((a)) ended at 7302.57 and Minute wave ((b)) ended at 7197.28. Subdivision of Minute wave ((a)) unfolded as an impulse where Minuttte wave (i) ended at 7134.53, Minutte wave (ii) ended at 7104.22, Minutte wave (iii) ended at 7290.82, Minutte wave (iv) ended at 7262.32, and Minutte wave (v) of ((a)) ended at 7302.57. The Index then pullback and ended Minute wave ((b)) at 7197.28
Minute wave ((c)) unfolded as an ending diagonal where Minutte wave (i) ended at 7280.7, Minutte wave (ii) ended at 7222.81, Minutte wave (iii) ended at 7460.20, and Minutte wave (iv) ended at 7435.64. Index has reached 1.618 extension of the Minute ((a)) – ((b)) and thus cycle from 4/20 low is mature and we are calling Minor wave 1 completed at 7533.7. Minor wave 2 decline from there is proposed complete at 7389.26. The Index has since resumed the rally higher and near term, while pullbacks stay above 7389.26, and more importantly above 7096.6, expect FTSE to extend higher. A break above Minor wave 1 at 7533.7 is needed to confirm the next leg higher has started. Until then, a double correction in Minor wave 2 can’t be ruled out. We don’t like selling the proposed pullback.
If FTSE breaks below 7389.26, this suggests the Index is still correcting within Minor wave 2 as a 7 swing structure and this would open extension to the downside to the next 100% – 123.6% in 7 swing. In the event that this happens, the Index remains favored to continue the rally higher again after the 7 swing correction is completed as far as pivot at 7096.6 low remains intact.
FTSE 1 Hour Elliott Wave Chart 05/23/2017
عضو المتداول العربي
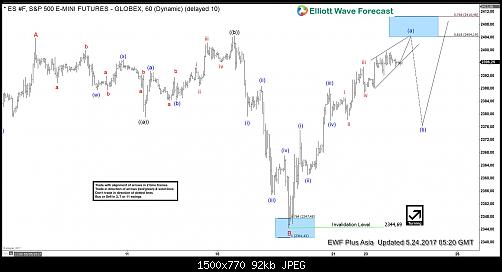
ES_F Elliott Wave View: Ending Impulse
Short Term Elliott Wave view in ES_F suggests the rally to 2403.75 ended Minor wave A. Minor wave B unfolded as an Expanded Flat Elliott Wave structure where Minute wave ((a)) ended at 2379, Minute wave ((b)) ended at 2404.5, and Minute wave ((c)) of B ended at 2344.5. After ending the pullback, the Index started a new leg higher and the rally from 2344.5 low looks to be unfolding as a 5 waves Elliott Wave impulse structure where Minutte wave (i) ended at 2375, Minutte wave (ii) ended at 2361, Minutte wave (iii) ended at 2388 and Minutte wave (iv) ended at 2378. Minutte wave (v) is in progress and the Index has scope to extend higher towards 2404.2 – 2410.5 area and this last push higher should also end Minutte wave (a).
Once Minutte wave (a) is complete, the Index is expected to pullback within Minutte wave (b) in 3, 7, or 11 swing to correct cycle from 5/18 low (2344.7) before the rally resumes again. Ideally the last push higher in Minutte wave (v) of (a) breaks above the previous peak at 2404.5 as a break above that level will give confirmation that the Index has started the next leg higher. If Minutte wave (a) can end above 2404.5, there’s a better chance that Minutte wave (b) pullback can hold above 2344.7 for the next leg higher. We don’t like selling the proposed pullback and expect buyers to appear again once Minutte wave (b) pullback is complete at later stage, provided that pivot at 2344.7 low remains intact.
ES_F 1 Hour Elliott Wave Chart 05/24/2017
عضو المتداول العربي
Randgold Resources Short Term Bullish Sequence
Randgold Resources (NASDAQ: GOLD) was founded 22 years ago in 1995, it’s a gold mining business operating in Africa mainly in Mali. The price of Gold & Silver dropped significantly early this month which put a lot of pressure on mining stocks but Rangold was one of the strongest and managed to rally %14 to make new 2017 high. Let’s take a look at the technical chart to identify the potential path.
Since the September 2015 low, GOLD rallied in 5 waves diagonal structure then topped in July 2016 like the precious metals. The stock corrected that rally in a double three structure which reached the equal legs area $72.51 – $64.62 and ended the 7th swing lower. So it held above 2015 low ($54) and bounced from the inflection area to create a higher low sequence supporting the idea of GOLD resuming the rally to the upside.
The Elliott Wave structure can be labeled in different ways depending on how the move will develop and the current most aggressive view would be another 5 waves from December 2016 low with the first wave already in place . Consequently as the stock already made new high last week then it’s now showing an incomplete bullish sequence from the lows that would at least take the stock higher toward equal legs area $110.75 – $117.28. So currently the pullback that should happen from inflection area $98.16-$95.37 needs to hold above March low and buyers needs to step up for the rally to resume higher. The alternative view in case the pivot at March low breaks then GOLD would be doing a flat structure from February peak and still in wave (2) which should ideally hold above $67.54 low to maintain the bullish view.
The short term path can be adjusted according to new price action but while pivot at December 2016 low is intact then the stock should extend higher to reach the equal legs area around $140 from 2015 low. That move can be counted as a simple Zigzag structure and take some time before it happens but it can also be a part of a new impulse sequence and accelerate to the upside.
Randgold Recap
The overall picture for the mining company is suggesting more gains to be seen in the future that could take Rangold stock toward $110 as a first step before breaking to new all time highs targeting $140. The move will be supported by a recovery in the precious metals and using Gold to Silver Ratio could be a good proxy to identify the right timing to start the next leg higher.
