

 الأكثر زيارة
 رد مع اقتباس


عروض شركات الفوركس
 | |  | |  |  |  |

 عضو المتداول العربي
موضوع جميل ومفيد جدا اول مرة أنتبه اليه
شكرا ياغالي للتحديث والمتابعة المستمرة
متابع معاك
عضو المتداول العربي
NZDUSD Elliott Wave View: More Upside
NZDUSD Short Term Elliott Wave view suggests that the Index shows a 5 swing sequence from 8/31 low favoring further upside. Rally from 8/31 low (0.7128) is unfolding as a double three Elliott Wave structure. Up from 0.7128, Minute wave ((w)) ended at 0.7338 and Minute wave ((x)) ended at 91.71. Wave ((y)) is currently in progress and the subdivision is also unfolding as a double three Elliott wave structure. Minutte wave (w) of ((y)) ended at 0.7344 and Minutte wave (x) of ((y)) ended at 0.7246. Near term, while pullbacks stay above 0.718, expect pair to extend higher. We don’t like selling the pair.
NZDUSD 1 Hour Elliott Wave Chart
9
عضو المتداول العربي
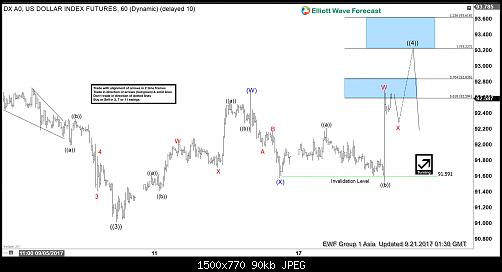
DXY Elliott Wave View: Double Correction
DXY Short Term Elliott Wave view suggests that the decline to 91.01 ended Primary wave ((3)). Primary wave ((4)) bounce remains in progress as a double three Elliott Wave structure. Up from 91.01, Intermediate wave (W) ended at 92.66 and Intermediate wave (X) ended at 91.591. Near term, while pullbacks stay above 91.591, expect Index to extend higher towards 93.227 – 93.618 area to complete Primary wave ((4)). Afterwards, Index should resume the decline lower or at least pullback in 3 waves. We don’t like buying the proposed bounce.
DXY 1 Hour Elliott Wave Chart
عضو المتداول العربي
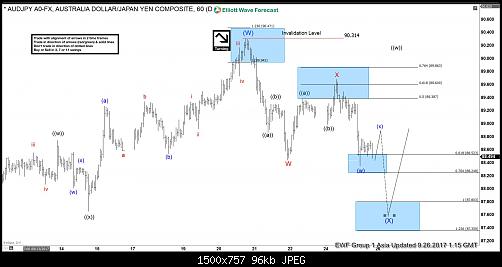
Elliottwave View: AUDJPY Doing a Correction
AUDJPY Short Term Elliott Wave view suggests that the rally to 90.31 ended Intermediate wave (W). Intermediate wave (X) pullback remains in progress as a double three Elliott Wave structure. Down from 90.31, Minor wave (W) ended at 88.44 and Minor wave (X) ended at 89.68. Near term, while bounces stay below 90.31, expect pair to extend lower towards 87.36 – 87.8 area to complete Intermediate wave (X). Afterwards, pair should resume the rally to a new high or at least bounce in 3 waves. We don’t like selling the proposed pullback.
AUDJPY 1 Hour Elliottwave Chart
عضو المتداول العربي
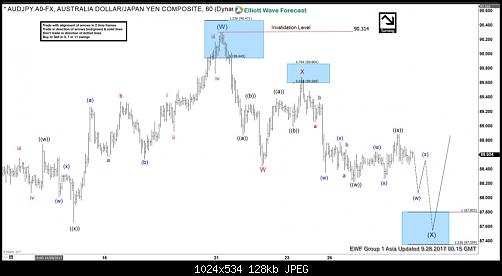
Elliott Wave Analysis: AUDJPY Correction Near Complete
AUDJPY Short Term Elliott Wave view suggests that the rally to 90.31 ended Intermediate wave (W). Intermediate wave (X) pullback remains in progress as a double three Elliott Wave structure. Down from 90.31, Minor wave W ended at 88.44 and Minor wave X ended at 89.68. Minor wave Y is unfolding also as a double three Elliott Wave structure. Minute wave ((w)) of Y ended at 88.23 and Minute wave ((x)) of Y is proposed complete at 88.89. Near term, while bounces stay below 9/21 peak at 90.31, expect pair to extend lower towards 87.36 – 87.8 area to complete Intermediate wave (X). Afterwards, pair should resume the rally to a new high or at least bounce in 3 waves. We don’t like selling the proposed pullback.
AUDJPY 1 Hour Elliottwave Chart
عضو المتداول العربي
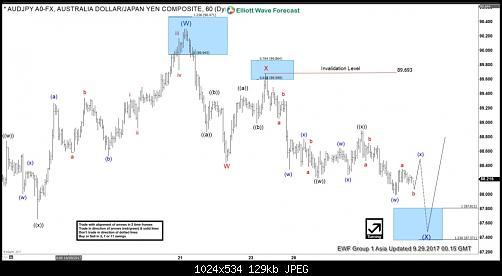
AUDJPY Elliott Wave Analysis 9.29.2017
AUDJPY Short Term Elliott Wave view suggests that the rally to 90.31 ended Intermediate wave (W). Intermediate wave (X) pullback remains in progress as a double three Elliott Wave structure. Down from 90.31, Minor wave W ended at 88.44 and Minor wave X ended at 89.68. Minor wave Y is unfolding also as a double three Elliott Wave structure. Minute wave ((w)) of Y ended at 88.23 and Minute wave ((x)) of Y is proposed complete at 88.89. Near term, while bounces stay below 9/25 peak at 89.69, expect pair to extend lower towards 87.37 – 87.8` area to complete Intermediate wave (X). Afterwards, pair should resume the rally to a new high or at least bounce in 3 waves. We don’t like selling the proposed pullback.
AUDJPY 1 Hour Elliottwave Chart
عضو المتداول العربي
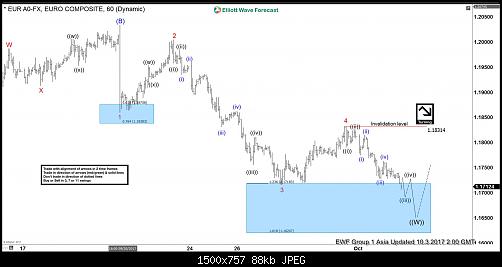
Elliott Wave Analysis: EURUSD in a flat correction
EURUSD Short Term Elliott Wave view suggests that the decline from 9/8 peak is unfolding as an expanded Flat Elliott Wave structure. Down from 9/8 high (1.2094), Intermediate wave (A) ended at 1.1837 and Intermediate wave (B) ended at 1.2034. Intermediate wave (C) is in progress as 5 waves. Minor wave 1 of (C) ended at 1.186, and bounce to 1.2 ended Minor wave 2 of (C). Down from there, Minor wave 3 of (C) ended at 1.1716, and bounce to 1.1832 ended Minor wave 4 of (C). Minor wave 5 of (C) remains in progress and can reach as low as 1.16207. This area will also complete Primary wave ((W)) and end cycle from 9/8 peak. Afterwards, pair should bounce within Primary wave ((X)) to correct cycle from 9/8 peak in 3, 7, or 11 swing before turning lower again.
Alternatively, if pair extends below 1.16207, then the entire move lower from 9/8 high could be labelled as 5 waves impulse. In this case, the current decline will only end Intermediate wave (3). Then pair should bounce in Intermediate wave (4) before the decline resumes again.
EURUSD 1 Hour Elliott Wave Chart
عضو المتداول العربي
MU Micron Technology INC – Buy the Next Dip
Today we are going to take a look at the weekly chart of the MU Micron Technology Inc. stock which shows a very interesting price structure.
Before we proceed with the analysis, few words about the company. According to Wikipedia, Micron Technology Inc. is an American global corporation based in Boise, Idaho. Furthermore the company produces many forms of semiconductor devices, including dynamic random-access memory, flash memory, and solid-state drives. It’s consumer products are marketed under the brands Crucial Technology and Lexar. Micron and Intel together created IM Flash Technologies, which produces NAND flash memory.
By looking at the Stock price, 2016 and 2017 have been great years for MU. The stock has achieved an 400% parabolic extension to date from the lows at 9.31. The surge in the stock’s price is affiliated mostly to the company’s revenue growth in both sequential and annual basis.
We won’t get into more details with Micron’s very good economic condition but instead focus on the company’s stock.
MU Micron Technology – Weekly Chart
The MU stock has a bullish incomplete sequence from the 11/17/2008 lows at 1.59. Additionally has a bullish sequence from the 2016 lows as well indicating 5 waves for wave ((A)). The 2008 sequence is in effect after breaking above the 12/2014 peak at 36.59. The second after taking the ((A)) peak at 32.33. After short term pull backs the Stock should continue extending higher until reach the equal legs – 1.236% extension of the w – x in red swing at the 42.50’s – 50.34 zone. Additionally, the stock should extend to the 2016 cycle ((A)) – ((B)) equal legs – 1.236% extension to the 50.34 – 56 zone.
From there we should see a larger degree pull back in (x) but at this point to soon to create any calls for that correction.
عضو المتداول العربي
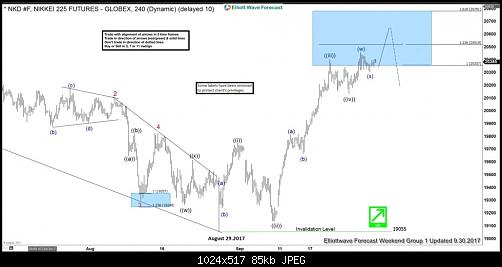
Nikkei ( NKD_F) Elliott Wave View: Diagonal Structure
Short term Elliott wave view in Nikkei suggest that the cycle from August 29.2017 low (19055) is unfolding in 5 waves pattern. However looking at the internal subdivision of each wave the bounce looks corrective in nature with upside extensions. Thus suggesting that the Nikkei cycle from August 29 low (19055) could be following a leading Diagonal pattern in Minor wave A higher.
Where Minute wave ((i)) ended at 19740 peak as a flat structure, Minute wave ((ii)) ended at 19229. Minute wave ((iii)) ended at 20496 peak in 3 swings as zigzag structure. Where Minutte wave (a) ended at 19898 and Minutte wave (b) at 19765 low. Minute wave (((iv)) ended at 20131 low. From there Minute wave ((v)) remains in progress in 3 swings, where Minutte wave (w) ended at 20460, Minutte wave (x) at 20305 low. While above 20131 low, Index is expected to see further strength towards 20630 – 20707 to complete wave ((v)) of the Diagonal structure and then it should pull back in 3 waves at least. RSI divergence with respect to wave ((iii)) should remain intact with the next push higher for the diagonal ideal to remain valid. If RSI divergence is erased, then structure would become a triple three Elliott wave structure.
Nikkei 4 Hour Elliott Wave Chart
موقوف
موفقين
عضو المتداول العربي
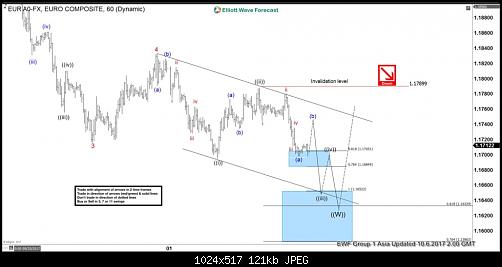
EURUSD Intra-Day Elliott Wave Analysis
EURUSD Intra-Day Elliott Wave view suggests the decline from 9/8 peak remains in progress as an expanded Flat Elliott Wave structure. Down from 9/8 high (1.2094), pair ended Intermediate wave (A) at 1.837. Bounce to 1.2034 ended Intermediate wave (B). Intermediate wave (C) remains in progress and unfolding as 5 waves impulse where Minor wave 1 of (C) ended at 1.186, and Minor wave 2 of (C) ended at 1.2. Down from there, Minor wave 3 of (C) ended at 1.1716 and bounce to 1.1832 ended Minor wave 4 of (C).
While EURUSD stays below 1.1789, it has scope to extend lower in Minor wave 5 of (C) and reach 1.1586 – 1.1633 area. The move lower will also end cycle from 9/8 peak and complete Primary wave ((W)). Afterwards, Pair should bounce in Primary wave ((X)) to correct cycle from 9/8 peak in 3, 7, or 11 swing at least. If pair breaks above 1.17899 from here without making a new low, pair may have ended Primary wave ((W)) already.
EURUSD 1 Hour Elliott Wave Chart
عضو المتداول العربي
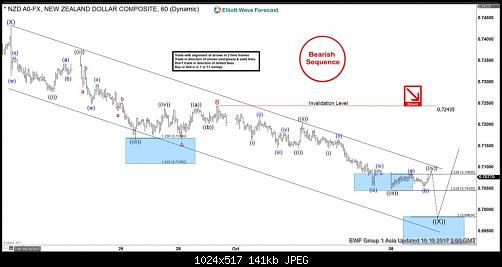
NZDUSD Short-term Elliott Wave Analysis
NZDUSD Short term Elliott Wave view suggests the decline from 9/20 peak remains in progress a zigzag Elliott Wave structure. Down from 9/20 high (0.7434), pair ended Minor wave A at 0.7165. Subdivision of Minor wave A unfolded as 5 waves impulse where Minute wave ((i)) of A ended at 0.7276 and bounce to 0.7362 ended Minute wave ((ii)) of A. Afterwards, decline to 0.7166 ended Minute wave ((iii)) of A and Minute wave ((iv)) of A ended at 0.7239. Minute wave ((v)) of A completed at 0.7165. Pair then bounced in Minor wave B in 3 waves and ended at 0.7243. Minor wave C is currently in progress and unfolding also as 5 waves impulse. Minute wave ((i)) ended at 0.7145, Minor wave ((ii)) ended at 0.7206, and Minute wave ((iii)) at 0.7049. While Minute wave ((iv)) bounce stays below 9/29 peak (0.7243), expect pair to extend lower towards 0.6919 – 0.6983 before ending cycle from 9/20 peak.
NZDUSD 1 Hour Elliott Wave Chart
عضو المتداول العربي
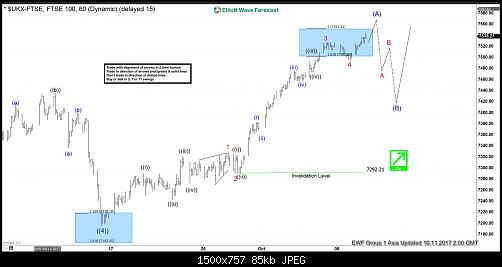
FTSE Elliott Wave Analysis 10.11.2017
FTSE Short term Elliott Wave analysis suggests the decline to 7196.58 on 9/15 low ended Primary wave ((4)). The Index is currently within Primary wave ((5)) which is subdivided as a zigzag Elliott Wave structure. The first leg Intermediate wave (A) of this zigzag is in progress as 5 waves impulse where Minor wave 1 ended at 7327.50 and Minor wave 2 ended at 7289.75. Up from there, Minor wave 3 ended at 7527.59 and Minor wave 4 ended at 7493.68. The Index has broken above Minor wave 3 at 7527.59, suggesting that it’s in the final Minor wave 5 higher which should also complete Intermediate wave (A).
Cycle from 9/15 low is mature and Intermediate wave (A) could end soon. Once Intermediate wave (A) is complete, Index should pullback in Intermediate wave (B) in 3, 7, or 11 swing to correct cycle from 9/15 low (7196.58) before the rally resumes. We do not like selling the proposed pullback. As far as pivot at 9/15 low stays intact in the Intermediate wave (B) pullback later, expect Index to extend to a new high.
FTSE 1 Hour Elliott Wave Chart
عضو المتداول العربي
موضوع ممتاز والله ماشاء الله موفقين ومتابعين لكم
متداول متميز / مشرف سابق
thank you bro
keep going
