

 الأكثر زيارة

 رد مع اقتباس


عروض شركات الفوركس
 | |  | |  |  |  |

 عضو المتداول العربي
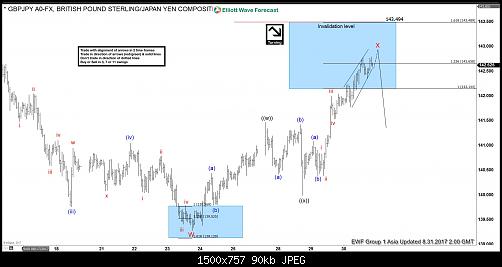
GBPJPY Elliott Wave View: Ending correction
GBPJPY Short Term Elliott Wave suggests that the decline to 8/23 low at 139.27 ended Minor wave W. Minor wave X bounce is currently unfolding as a double three Elliott Wave Structure. Minute wave ((w)) of X ended at 141.47, Minute wave ((x)) of X ended at 139.98, and Minute wave ((y)) of X is subdivided into a FLAT. Minutte wave (a) of ((y)) ended at 141.09 and Minutte wave (b) of ((y)) ended at 140.39. Minute wave ((y)) of X has now reached 1.236 extension of ((w))-((x)) and thus the cycle from 8/23 low (139.27) is mature. Sellers may appear anytime from 142.65 – 143.49 area for an extension lower or at least a 3 waves pullback. We don’t like buying the pair.
GBPJPY 1 Hour Elliott Wave View
عضو المتداول العربي
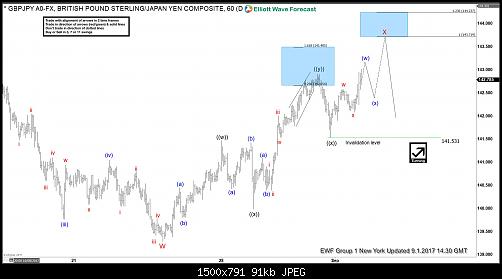
GBPJPY Elliott Wave View: Wave Red X Still in Progress
September 1, 2017 By EWFHendra (Edit)
GBPJPY Short Term Elliott Wave suggests that the decline to 8/23 low at 139.27 ended Minor wave W. Minor wave X bounce is currently still in progress as a double three Elliott Wave Structure. Minute wave ((w)) of X ended at 141.47, Minute wave ((x)) of X ended at 139.98, and Minute wave ((y)) of X is proposed complete at 142.93. The move higher from Minor W can be counted as a triple three. In this case, it will open extension higher to 143.75 – 144.27 area before pair turns lower.
GBPJPY 1 Hour Elliott Wave View
عضو المتداول العربي
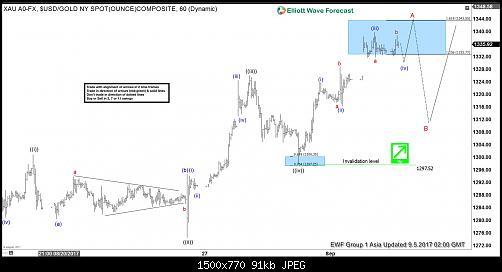
Gold Elliott Wave View: 5 Waves Up
Gold Short Term Elliott Wave suggests that the rally from 8/15 low is unfolding as a zigzag. The first leg Minor wave A is subdivided as an impulse. Minute wave ((i)) of A ended at 1300.83, Minute wave ((ii)) of A ended at 1274.45, Minute wave ((iii)) of A ended at 1326, and Minute wave ((iv)) of A ended at 1297.52. Minute wave ((v)) of A is currently in progress and also subdivided as an impulse.
Minutte wave (i) of ((v)) ended at 1323.63, Minutte wave (ii) of ((v)) ended at 1316.3, and Minutte wave (iii) of ((v)) ended at 1339.77. Gold is currently in Minutte wave (iv) of ((v)) pullback before another leg higher to complete Minor wave A. Afterwards, Gold should pullback in Minor wave B to correct cycle from 8/15 low before the rally resumes. We don’t like selling Gold and expect buyers to appear once wave B pullback is over in 3, 7, or 11 swing as far as pivot at 8/15 low (1267.21) stays intact.
Gold 1 Hour Elliott Wave Chart
عضو المتداول العربي
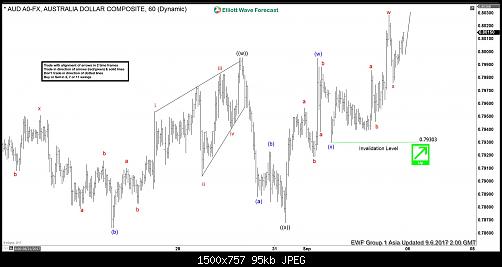
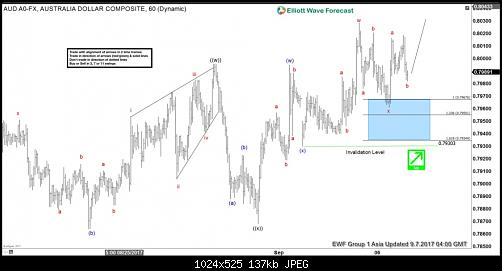
AUDUSD Elliott Wave View: More Upside
AUDUSD Short Term Elliott Wave view suggests that the rally from 8/15 low is unfolding as a double three Elliott Wave structure. Up from 8/15 low, Minute wave ((w)) ended at 0.79957 and Minute wave ((x)) ended at 0.7868. Minute wave ((y)) is in progress and the subdivision also unfolds as a double three. Minutte wave (w) of ((y)) ended at 0.7995 and Minutte wave (x) of ((y)) ended at 0.793. Near term, while pullbacks stay above 0.793, but more importantly above 0.7868, expect pair to extend higher towards 0.806 – 0.8108. We don’t like selling the pair.
AUDUSD 1 Hour Elliott Wave Chart
عضو المتداول العربي
North Korea Nuclear test poses little threat to Indices rally
Geopolitical tensions intensified after North Korea conducted its sixth and most powerful nuclear test on Sunday, detonating what it said was a hydrogen bomb meant for intercontinental ballistic missile. The United States warned it could launch a “massive” military response if it or its allies were threatened. Most of the Stock Markets in the World reacted negatively to the news with stocks from around the World ending the day in the red.
We believe what we saw was some panic selling and not a huge sell off. We believe that markets move on the basis of cycles and swing sequences and news just acts as a catalyst rather than driving the markets. We believe North Korea’s nuclear test poses little threat to the rally in Indices as mid-long term cycles are still bullish. We will present long-term view in South Korean Stock Exchange to support our view that any sell off seen due to escalating geo-political tensions is still a buying opportunity.
$KOSPI-KOR denies huge sell off due to North Korea
KOSPI-KOR Index from South Korea is within 7th swing from 1980 low but has not yet reached the ideal target area. Sequence from 2008 low is also incomplete and calls for more upside towards 2891 – 3362 area as far as dips hold above 2011 low. As the sequence from 1980 and 2008 low in KOSPI-KOR is incomplete, any dips remain a buy in 3, 7 or 11 swings as far as pivot at 2011 low remains intact. North Korea’s nuclear test or any military offensive should have a direct impact on South Korea’s stock exchange and as the sequence is bullish, we believe nothing drastic will come out of the current scenario, it can cause a pull back but that should be a buying opportunity looking for a move higher towards 2891 – 3362 area.
$KOSPI-KOR Long-Term Elliott Wave View
$KOSPI-KOR rally from 1980 low could be viewed as a double three Elliott wave structure or it could be viewed to be in wave (III) of an incomplete Leading Diagonal structure. In either case, rally sequence is incomplete and as dips hold above wave ((2)) and more importantly “b” low, expect the Index to resume the rally towards 2893 – 3362 area to reach the extreme from 1980 low. From this area, Index can see a larger pull back to correct the cycle from 1980 low or at least from 2008 low labelled as (x) / (II). We don’t like selling the Index and expect to see buyers appearing after dips in 3, 7 or 11 swings as far as pivot at 2015 and 2011 lows remain intact.
عضو المتداول العربي
AUDUSD Elliott Wave View: Bullish above 0.787
AUDUSD Short Term Elliott Wave view suggests that the rally from 8/15 low is unfolding as a double three Elliott Wave structure. Up from 8/15 low, Minute wave ((w)) ended at 0.79957 and Minute wave ((x)) ended at 0.7868. Minute wave ((y)) is in progress and the subdivision also unfolds as a double three. Minutte wave (w) of ((y)) ended at 0.7995 and Minutte wave (x) of ((y)) ended at 0.793. Near term, while pullbacks stay above 0.793, but more importantly above 0.7868, expect pair to extend higher towards 0.806 – 0.8108. We don’t like selling the pair.
AUDUSD 1 Hour Elliott Wave Chart
عضو المتداول العربي
Gold Soars Above $1300 as Concerns Mount
Gold has tested $1300 level 3 times since April and it finally broke above the level on Monday and rose to the highest level this year. The trigger of the break seems to be the North Korea firing a ballistic missile over Japan, which boosts the safe haven demand. The yellow metal then extended the rally to 11 month high after North Korea nuke test. Gold’s strength, however, can not be attributed to just one event, but rather over a series of concerns which start to build a wall of worry among investors.
A few weeks ago, White House chief economic adviser Gary Cohn came close to resigning after president Trump’s response of blaming “both sides” in the deadly violence at Charlottesville, Virginia. Mr. Cohn is the main architect of President Trump’s tax reform agenda, and thus when news of his possible departure started to circulate around Aug 17, markets were spooked. Then there are also concerns of government shutdown if the debt ceiling is not raised. If this happens, it will trigger technical default on U.S debt.
Apart from the argument of safe haven demand, Gold for some people is considered as the best form of sound money. Unlike fiat money which can be printed ex nihilo, Gold has limited quantities. It has survived thousands of years as a form of money, longer than any other alternative forms of payment. The chart below compares Gold’s role as store value vs the fiat:
The chart above shows that while equity markets are hitting all-time highs in USD term, it peaked against Gold in 2000 and remain 70% below the peak.
We believe Gold’s dual role as sound money and safe haven demand will become more prominent in the next coming months as the massive Quantitative Easing experiment by central banks around the world start to reveal the true costs. This month, we shall also see the market reaction to the U.S. Fed’s plans to normalize their balance sheet and taper bonds reinvestment. On paper, this is the same as money tightening and thus could have the opposite effect of money printing.
Gold Daily Elliottwave Sequence Chart
The Daily Chart of Gold shows the sequence from 12.15.2016 is bullish and favors more upside towards 1376.8 – 1417.6. When Gold reaches this area, it will also break above 7.6.2016 peak at 1375.15 which opens another larger bullish sequence from 12.3.2015 low. Thus, we don’t like selling Gold in any pullback and prefer to buy dips in 3, 7, or 11 swing.
عضو المتداول العربي
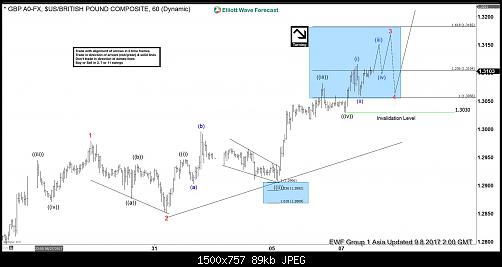
GBPUSD Elliott Wave View: More Upside
GBPUSD Short Term Elliott Wave view suggests that the rally from 8/24 low is unfolding as an impulse Elliott Wave structure. Up from 8/24 low (1.2773), Minor wave 1 ended at 1.2979 and Minor wave 2 ended at 1.2851. Minor wave 3 is in progress and the subdivision is unfolding as an impulse Elliott Wave structure. Minute wave ((i)) of 3 ended at 1.2947, Minute wave ((ii)) of 3 ended at 1.2907, Minute wave ((iii)) of 3 ended at 1.3082 and Minute wave ((iv)) of 3 ended at 1.303. Minute wave ((v)) of 3 is expected to end soon within 1.3104 – 1.3182 area. Afterwards, pair should pullback in Minor wave 4 before the rally resumes. We don’t like selling the proposed pullback.
GBPUSD 1 Hour Elliott Wave Chart
عضو المتداول العربي
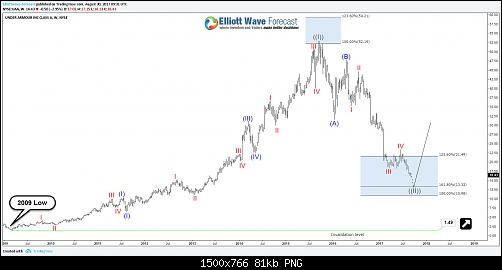
Under Armour UAA Weekly Elliott Wave Outlook
Under Armour (NYSE: UAA) is one of the leading sporstwear companies around the world. However it’s stock has been struggling in the recent 2 years as it lost %68 since September 2015.
In our previous article, we pointed out to the current correction taking place which could turn out to be 3 waves flat structure. It turned out to be the case for UAA and the stock currently extending lower into the 123.6% – 1.618% fib ext area (21.49 – 13.32) where it’s expected to end the correction in wave ((II)) and resume higher or bounce in 3 waves at least.
UAA can extend further toward 10.98 which is the target for wave I = wave V but we need to be aware that it has already enough number of swings in place to end the cycle from 09/17/2015. That’s why it’s not recommended to chase the short side at current stage.
Overall, UAA will remain under pressure until it manage to break the short term pivot of wave IV at 23.46 as a first step then we’ll be looking for the next leg higher to take it above $52 or fail below it for a double correction taking place in a later stage.
UAA Weekly Chart
عضو المتداول العربي
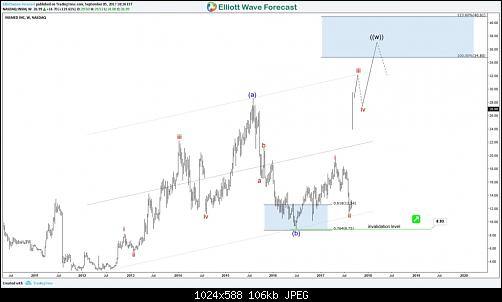
INSM Insmed Inc Stock Skyrocketed
INSM Insmed Inc Stock Skyrocketed by a staggering 120% higher recently.
According to Nasdaq.com, the Insmed Inc. INSM stock advanced more than double in the pre-market trading after the company announced that its new drug, an inhaled antibiotic known as Alis, successfully treated patients with a rare lung disease. More specifically:
Alis met the main goal in a late-stage study involving 336 adult patients with nontuberculous mycobacterial lung infections. According to Insmed, the addition of the drug showed statistically significant reduction in bacterial density by month six in 29% of patients, compared to just 9% in patients receiving the standard treatment.
INSM Insmed Inc Stock Skyrocketed – Weekly Time Frame
Without any further delays lets take a look at the Weekly Chart. Price has extended from the all time lows at 2.60 suggesting cycle from 08/28/2000 has been completed and should see at this stage a correction against the 199.22 highs. And of course is too early too make huge calls, the reason we are going to take it step by step.
At this stage and as the following chart indicates, INSM has extended with waves iii red while in 3rd swing up for ((w)). Short cycles we should see a short term pull back and from there extend higher again to reach the equal legs – 1.236% extension at the zone of 34.80’s – 40.90’s before sellers appear. The view comes inline with our analysis relating to IBB and XLV ETF’s while both Funds are looking for additional extension higher. So at this point we are looking for the dip in wave iv red to trigger Long entries towards the targets higher as mentioned above.
INSM Insmed Inc Stock Skyrocketed - Weekly Time Frame
عضو المتداول العربي
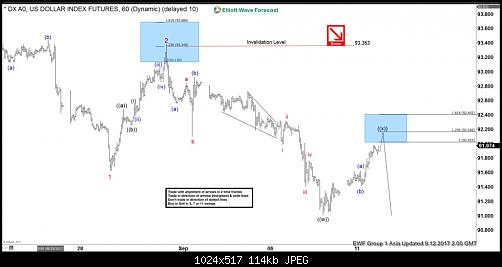
DXY Dollar Index Elliott Wave View: 9.12.2017
DXY Dollar Index Short Term Elliott Wave view suggests that the decline from 8/16 peak is unfolding as an Ending Diagonal Elliott Wave structure. Down from 8/16 high, Minor wave 1 ended at 91.62 and Minor wave 2 ended at 93.347. Minor wave 3 is unfolding as a double three Elliottwave structure. Minute wave ((w)) of 3 ended at 91.01 and Minute wave ((x)) of 3 is in progress. The internal subdivision of Minute wave ((x)) shows a zigzag Elliottwave structure. Minutte wave (a) of ((x)) ended at 91.62 and Minutte wave (b) of ((x)) ended at 91.41.
The Index has reached an inflection area where Minutte wave (c) = Minutte wave (a) and thus cycle from 9/8 low is mature. Expect Minute wave ((x)) of 3 to end at 92.02 – 92.4. While bounces stay below 93.36, Index should resume lower or at least pullback in 3 waves. We don’t like buying the Dollar Index.
DXY 1 Hour Elliott Wave Chart
عضو المتداول العربي
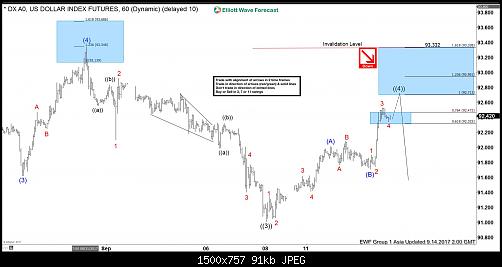
DXY Elliott Wave View: Zigzag Correction
DXY Dollar Index Short Term Elliott Wave view suggests that the Index ended Primary wave ((3)) at 91.01 and currently in a Primary wave ((4)) bounce. Internal of Primary wave ((4)) is unfolding as a zigzag Elliott wave structure. Preferred view suggests rally to 92.01 completed Intermediate wave (A) and dip to 91.71 ended Intermediate wave (B) as an expanded Elliott wave FLAT. Expect the Index to continue higher towards 92.71 – 92.95 area to complete Primary wave ((4)). Afterwards, the Index should resume the decline lower or at least pullback in 3 waves. We don’t like buying the Dollar Index. Expect sellers to appear at 92.71 – 93.33 area for a 3 waves reaction lower at least. If the rally in the Dollar Index extends beyond 93.33 (1.168 extension), the move from 9/8 low could unfold as impulse instead.
DXY 1 Hour Elliott Wave Chart
عضو المتداول العربي
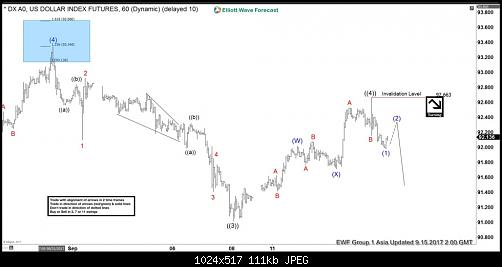
DXY Elliott Wave View 9.15.2017
DXY Dollar Index Short Term Elliott Wave view suggests that the Index ended Primary wave ((3)) at 91.01. Primary wave ((4)) bounce is proposed complete at 92.66 as a double three Elliott Wave structure. Wave (W) of ((4)) ended at 92.01, wave (X) of ((4)) ended at 91.71, and wave (Y) of ((4)) is proposed complete at 92.66. Down from there, Intermediate wave (1) ended at 91.97. Intermediate wave (2) bounce is in progress in 3, 7, or 11 swing to correct cycle from 9/14 peak. While bounces stay below there, expect Index to extend lower. We don’t like buying the Dollar Index.
DXY 1 Hour Elliott Wave Chart
عضو المتداول العربي
CADJPY Elliott Wave Sequence still bullish
CADJPY Elliott Wave Sequence is bullish and incomplete to the upside due to which we have been telling clients not to sell the pair and use the dips as an opportunity to get long for higher prices. Our Live Trading Room was able to catch a long in CADJPY for a profit of +197 pips recently and in this blog, we will take a look at CADJPY daily chart to show that the rally is not over yet and any pull backs should still be viewed as a buying opportunity in the sequence of 3, 7 or 11 swings.
CADJPY Elliott Wave Sequence from 11.9.2016
Daily chart of CADJPY shows the pair rallied in 3 waves from 11.9.2016 low to 12.15.2016 high. Then, the pair pulled back to 50 – 61.8 Fibonacci retracement area of the rally from 11.9.2016 low and made a new high above 12.15.2016 peak. As soon as pair broke above 12.15.2016 peak, it created a bullish Elliott wave sequence with a target of 94.57 – 97.91 area. We know that market doesn’t move in a straight line and always does pull backs. Since the pair broke above 12.15.2016 peak, we have been telling clients to use pull backs as a buying opportunity in 3, 7 or 11 swings. As far as dips hold above 8.11.2017 low i.e blue (X) low, pair should remain supported and see more upside towards 94.57 – 97.91 area.
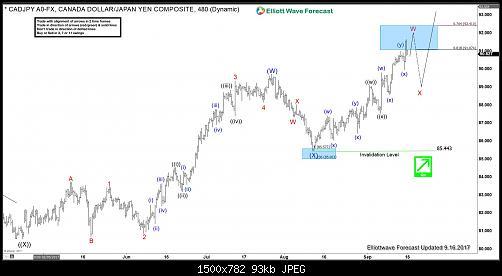
CADJPY 8 Hour Elliott Wave Analysis
Pair is showing 5 swings up from 4.19.2017 low which makes Elliott wave sequence incomplete and bullish against 8.11.2017 low in this time frame. Pair has reached 0.618 – 0.764 Fibonacci extension area of (W)-(X). This is the area which will typically end 5th swing in a 7 swing sequence. Therefore, we don’t like chasing the longs here as a pull back can be seen soon in wave X. We don’t like selling the pair and expect wave X pull back to find buyers in 3, 7 or 11 swings as far as pivot at 8.11.2017 i.e. blue (X) at 85.44 low remains intact.
عضو المتداول العربي
AECOM Resuming the Rally Toward $50
AECOM (NYSE:ACM) provides planning, consulting, architectural and engineering design and program and construction management services for a range of projects including highways, airports, bridges, mass transit systems, to government and commercial clients. The company had US$17.4 billion of revenue during fiscal year 2016, it’s been ranked number one in Engineering News Record‘s “Top 500 Design Firms” for 8th consecutive year and named one of Fortune magazine’s “World’s Most Admired Companies” for the third consecutive year.
From 2008 low, AECOM stock is showing 5 swings incomplete bullish sequence which is different from the regular impulsive 5 waves move as we use this sequence as part of our new way of applying Elliott Wave Theory to the market. We believe that many instrument has the ability to trend using corrective Elliott wave structure rather then trending in 5 waves move, so this move is considered as part of a double three structure which has 7 swings.
AECOM managed last year to make new all time high, so using 2014 peak & 2016 low as a connector, the stock is looking to extend higher toward equal legs area 46.53 – 52.14 before ending the cycle from 2008 low.
AECOM Weekly Chart
AECOM ended 3 waves pullback from 12/12/2016 peak after it reached the 50-61.8 fib retracement area 31.75 – 29.63, so currently as long as it remains above the recent August low at 30.15 and most importantly as long as 22.84 pivot keeps holding then AECOM will extend higher to make new all time highs and reach the target around the $50 area.
AECOM Daily Chart
Recap
AECOM has a bullish structure and technically it has resumed the move higher unless the move truncates without reaching the target and decide to make the double correction from 2016 peak. It’s not recommended to sell it and it’s better to look for buying opportunity during short term pullbacks using corrective structures in 3 , 7 or 11 swings.
