

 الأكثر زيارة


 رد مع اقتباس


عروض شركات الفوركس
 | |  | |  |  |  |

 عضو المتداول العربي
Walmart Stock Extending Higher
Walmart (NYSE: WMT) is the world’s largest company by revenue as well as the largest private employer in the world with 2.3 million employees. It’s an American multinational retailing corporation that operates as a chain of hypermarkets, discount department stores, and grocery stores. Despite being the biggest physical retailer in the world, Wal-Mart is still trailing back in e-commerce business as there is increased competition from online retailers in particular Amazon (NASDAQ: AMZN) which continues to gain market share as the world is merging to online shopping.
Warren Buffet reduced his shares in Wal-Mart, which he held since 2005, by roughly 90% last quarter. He indicated that the retail sector now looks too challenging and fewer people are choosing to go to physical stores, so Walmart’s competitive advantages in scale & distribution may not be as valuable as they once were.
Walmart’s stock is only up +9% this year compared to Amazon +19% rally which already made new all time high while WMT is still far from breaking its 2015 peak. However , last week it managed to break above 2016 peak so let’s the consequence for this technical move as the giant corporation already acquired a number of e-commerce companies, which means it’s looking seriously to move into the online retail world and investors seems to be liking the new changes.
Walmart Elliott Wave View:
Walmart stock dropped 37% from 01/13/2015 peak at $90.8 before finding ground later that year. So from 2015 low, WMT could either has started a new cycle to the upside as the weekly trend remain bullish or the stock is only bouncing to correct that cycle before doing the double three correction from $90.8. Either way, the recent break above 2016 peak opened a new short term extension to the upside as WMT is now showing 5 swing bullish sequence from November 2015 low. So unless the move truncates or it’s a part of an irregular correction, then the stock has a new target that can take it toward $84 area before a larger pullback is seen.
WMT established a low early this year at $65.25, from which it started a 7 swings structure move looking for a first target at equal legs area $76.62 – $78.61. From there the stock should pullback in 3 waves at least in red wave X before resuming the move higher while holding above January 2017 low.
The stock doesn’t need a large pullback and could keep extending higher forming a diagonal with the current leg as wave ((iii)). The surprise would happen if the current leg higher is wave B of a Flat structure in wave (X) which means there will be a sharp 5 waves decline after ending the current leg higher. But we don’t call Flats against the main trend which remain bullish until the move happens.
Recap:
Walmart may not look as a good long term investment as it used to be but the technical bullish sequence is suggesting that WMT price will see more gains during the rest of 2017 as short term investors still believe in the company. So while this year’s low is holding, corrective pullbacks will remain supported by the bulls.
عضو المتداول العربي
USDCAD Elliott Wave View: More Upside
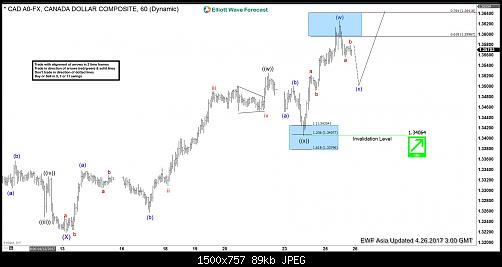
Short term Elliott Wave view in USDCAD suggest the decline to 1.322 ended Intermediate wave (X). Revised view suggests that the rally from there is unfolding as a double three Elliott Wave structure where Minute wave ((w)) ended at 1.3525 and Minute wave ((x)) ended at 1.3406. Minute wave ((w)) is subdivided as a Flat Elliott wave structure where Minutte wave (a) ended at 1.3338 and Minutte wave (b) ended at 1.3258. Near term, pair is within Minutte wave (x) pullback to correct the cycle from 4/24 low in 3, 7, or 11 swing before the rally resumes. We don’t like selling the proposed pullback and expect buyers to appear once wave (x) pullback is complete in 3, 7, or 11 swing as far as pivot at 1.3406 stays intact.
USDCAD 1 hour Elliott Wave Chart 04/26/2017
عضو المتداول العربي
Elliott Wave Theory: Is Elliott’s Theory enough?
Elliott wave Theory: Is Elliott’s Theory a system in itself?
As many traders know, The Elliott wave Theory is a form of technical analysis that finance traders use to analyze financial market cycles and forecast market trends by identifying extremes in investor psychology, highs and lows in prices, and other collective factors. Elliott’s Theory was developed by Ralph Nelson Elliott and published in 1938 in the book The Wave Principle. The Theory states that collective investor psychology, or crowd psychology, moves between optimism and pessimism in natural sequences. These mood swings create patterns evidenced in the price movements of markets at every degree of trend or time scale.
In Elliott’s Theory, market prices alternate between an impulsive, or motive phase, and a corrective phase on all time scales of trend, as the illustration shows. Impulses are always subdivided into a set of 5 lower-degree waves, alternating again between motive and corrective character, so that waves 1, 3, and 5 are impulses, and waves 2 and 4 are smaller retraces of waves 1 and 3. Corrective waves subdivide into 3 smaller-degree waves starting with a five-wave counter-trend impulse, a retrace, and another impulse. Motive waves always move with the trend, while corrective waves move against it.
We do understand the idea and we practice the idea every single day, we do over 4000 charts every month and we have seen that even when the Patterns happen because of the nature of the Market which comes with 2 sides, the bulls and bears which by definition is a fight between both of them. Reality is that most wavers practice the Theory looking for the 5 waves and 3 waves back and 90 % of the time they end up been wrong. We are not saying that Elliott’s Theory cannot be used, but by nature the Theory is great after the fact and not enough to forecast the future. As Humans, we tend to live in a state of denial and taking the easier road always come by nature. I started Elliottwave–Forecast in 2005 and did the analysis on the basis of Elliott Wave Theory. I was always looking for 5 waves and trading those waves 4’s and 5’s like everyone else does. With passage of time, I started opening my mind and understanding that the Theory is a way of communication instead of a way of forecasting. In simple words, the theory always is right after the fact but when market is moving and structures are developing, there is always more than one possible path and sometimes quite a few paths are there and none of them would break the rules of Elliott wave theory. That let me to believe that if Elliottwave-Forecast will stick around, it can’t be based only in Elliott’s Theory and other tools were needed. My Background comes from Engineering and consequently my mind is educated to see the patterns and think outside the box, I cannot be a blind follower, I need to think by myself, otherwise I won’t be me and lose my identity.
As time passed by, I started noticing something in the market, it was contrarian to what the Theory states. Theory states that that trend always comes in 5 but I noticed that trends can come in 5 waves and also in 3 waves. I also noticed the market following a code either by nature or through Human manipulation. As I said before, by nature I need to think outside the box and consequently, can’t follow blindly a Theory developed in the absence of Banks, Investment Houses and when the communication between humans was not even 5% of what it is today. There were no computers and consequently, no way Elliott’s Theory will work today, like it did in 1930’s. Today, we believe that: the Market follow patterns, but trend is not always in 5 waves, it can have an impulse sequence (5-9-13) or a corrective sequence (3-7-11). Traders need to have an open mind, otherwise will be showing only the charts or making money when the 5 waves happen which percentage wise are not that high specially when it comes to the Forex market. We believe in the Idea of cycles, sequences, time cycles, distribution, correlations and Elliott wave Patterns. We think a combination of tools makes up a forecast and not the Elliott Wave Theory or Market Psychology alone.
Few tips
The Market trends in 5 waves and also trends in 3 waves.
Elliott’s Theory needs to be part of a system, it’s not a system in itself.
Trade areas when both bulls and bears are in agreement.
Always looks for combinations of time frames.
Follow the cycles in time and price, sequences and distribution.
Understand that the MARKET is created and manipulated by someone using a code.
Think outside the box.
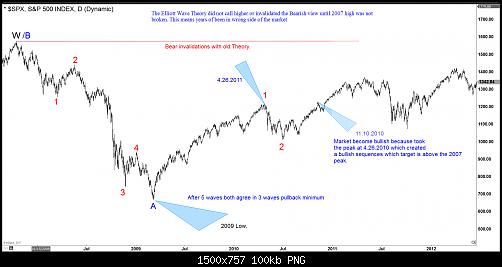
A great example is the $SPX, looking at the Monthly chart, the instrument peaked either in 2000 or in 2007. If you are practicing Elliott’s Theory like in 1930’s, you will see 5 waves from 2007 which will make your mind completely bearish and when the 5 waves ended in 2009, you would be calling for a recovery in 3 waves and then another 5 waves lower to the 300-200 areas. Truth is nothing denies that looking at the 5 waves down and also practicing the 1930’s Elliott Wave Theory. Reality is something else and needs to be seen with other tools and an open mind. The 2007 peak was a marginal new high above 2000 peak, also using a momentum indicator, it can be observed that momentum at 2007 peak is less than the momentum at 2000 peak which together with the 5 waves fast decline makes the case for a text book FLAT. As a new thinking with the Theory, we know that after 5 waves lower, a bounce will happen at least in 3 waves and before we start calling a huge crash in SPX and the World coming to an end, we want to see how the bounce develops and look for answers using market correlation. We are living in the present times, think differently and outside the box.
In early 2009, nothing denied the ABC Elliott wave structure in SPX from 2007 peak except for the momentum divergence at the peak. We use divergence differently than most because the divergence doesn’t always mean weakness, depending on the sequence sometimes it means incomplete sequence and more strength to come. As I said before, forecasting needs to be based off a system and not a single tool. Following the SPX, when the bounce started unfolding, we were looking for 3 waves higher because as per Elliott wave Theory hedging both sides agrees in the bounce until the moment when something within the system will called the next move. The SPX recovered and did 3 waves until 4.2010 and then dropped again, so far everything played out as planned and both scenarios were still valid until then. Then it rallied again from 7.2010 low and took the peak at 4.2010 and the moment it did that, sequence turned bullish calling for new high towards 2300 area. The bears lost that day and the ABC from 2007 was invalidated and from that day onwards, FLAT was the primary wave count. Primary reason for this was the moment 4.2010 peak was taken, 100% extension from 2009 low came above 2007 peak. Of course, Elliott wave Theory like 1930, did not deny the ABC until the 2007 peak was taken, but reality is that based on our out of the box thinking and not following the Theory like in 1930, we knew the SPX was bullish and will trade 2300 and even to 3000. To conclude, Elliott Wave Theory is not enough and trading only based in 5 waves and 3 waves back is a thing of the past, the past is past and future is ahead which requires thinking outside the box. We become better every day, we developed computers, Planes, Electricity thinking outside the box and the box is the Elliott wave Theory like was develop in 1930.
عضو المتداول العربي
USDCAD Elliott Wave View: Flat correction
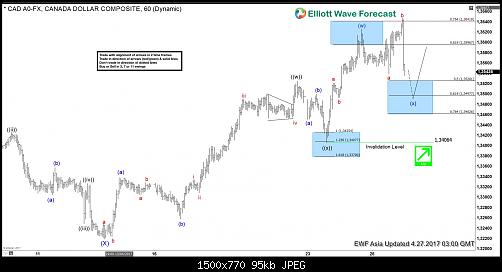
Short term Elliott Wave view in USDCAD suggest the decline to 1.322 ended Intermediate wave (X). The rally from there is unfolding as a double three Elliott Wave structure where Minute wave ((w)) ended at 1.3525 and Minute wave ((x)) ended at 1.3406. Minute wave ((w)) is subdivided as a Flat Elliott wave structure where Minutte wave (a) ended at 1.3338 and Minutte wave (b) ended at 1.3258. Near term, pair is within Minutte wave (x) Flat pullback to correct the cycle from 4/24 low towards 1.346 – 1.3498 area before the rally resumes. We don’t like selling the proposed pullback and expect buyers to appear once wave (x) pullback is complete in 3, 7, or 11 swing as far as pivot at 1.3406 stays intact.
USDCAD 1 hour Elliott Wave Chart 04/27/2017
عضو المتداول العربي
USDCAD Elliott Wave View: Extending Higher
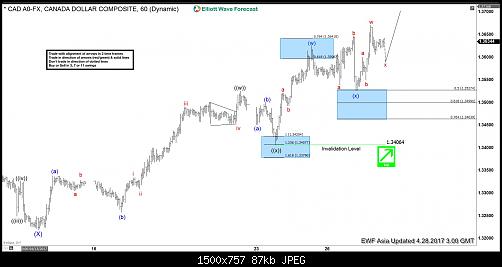
Short term Elliott Wave view in USDCAD suggest the decline to 1.322 ended Intermediate wave (X). The rally from there is unfolding as a double three Elliott Wave structure where Minute wave ((w)) ended at 1.3525 and Minute wave ((x)) ended at 1.3406. Minute wave ((w)) is subdivided as a Flat Elliott wave structure where Minutte wave (a) ended at 1.3338 and Minutte wave (b) ended at 1.3258. Pair is currently within Minute wave ((y)) which is unfolding as a double three Elliott Wave structure where Minutte wave (w) ended at 1.3626 and Minutte wave (x) FLAT ended at 1.3526. Near term, while pullbacks stay above 1.3406, expect pair to extend higher towards 1.3714 – 1.3787 area to end cycle from 4/13 low before a larger pullback in 3 waves can be seen at minimum to correct cycle from 4/13 low. We don’t like selling the proposed pullback.
USDCAD 1 hour Elliott Wave Chart 04/28/2017
عضو المتداول العربي
Freeport McMoRan (FCX) Outlook Turning Bullish
Freeport McMoRan Incorporation (NYSE: FCX) is the world’s largest publicly traded copper and molybdenum producer and it’s also a major producer of gold but almost 70% of revenues are from the sale of copper. The Phoenix, Arizona-based companyis primarily engaged in mineral exploration and development, mining and milling of copper, gold, molybdenum and silver, as well as the smelting and refining of copper concentrates.
In the recent 2 months, Freeport’s shares dropped 27% as it had interrupted the production in Grasberg mine which is the largest gold mine and the third largest copper mine in the world because of a regulatory restrictions in Indonesia on its copper concentrate exports. However, the company recently announced that the matter was resolved as it’s looking to protect and support its past & long-term investment plans in Indonesia and it’s now resuming exports of copper concentrate from. The recent actions helped its stock to bounce, but the move is still weak so let’s take a look a the technical picture using Elliott Wave Theory.
FCX Elliott Wave View
Weekly Chart: FCX did a double three structure from both 2007 & 2011 peaks and managed to reach both equal legs target at $9.15 & $4.16 with 7 swings already in place before finding a bottom early last year. Since then the stock managed to rally and it both cycles from the peaks already ended even the price level still didn’t break above the descending trend-line . Consequently the sentiment for the stock is turning bullish and it should be looking for a bigger 3 waves correction toward the 50% area around $32.
Daily Chart: The stock is showing 5 swing bullish sequence from January 2016 low and will remain supported as long as October 2016 low keeps holding. Currently it ended a flat correction in wave ((X)) and would ideally resume the move to the upside looking for a target at equal legs area 19.82 – 22.24 to end 7 swings sequence around the weekly trend-line and start a 3 waves pullback.
The short term turn around for FCX would happen if the stock has already ended the cycle from January 2016 low, in that case it will be only doing 3 waves bounce against the peak before another leg lower take place toward the 50%-61.8% Fibonacci area around $10.3 – $8.71 then the stock find buyers again as long as pivot at 3.52 is holding.
Recap:
The mining giant Freeport McMoRan is in a good financial shape despite the Grasberg mine issue in Indonesia and the technical outlook for its stock is turning to the upside as long as the 2016 low at $3.52 keeps holding. This means unless the company go bankrupt then no matter what path it will take in the near term, it will end up bouncing to higher level around $20 at first stage either from current levels or from $10 area then it will be looking to extend toward $33 later on.
عضو المتداول العربي
Trump tax cut can create the last rally since 2016
As part of President’s Trump campaign pledge, he wants to sharply reduce the tax rate for all businesses from multinational corporations to mom-and-pop shops to 15%. Treasury Secretary Steven T. Mnuchin said this is the biggest tax cut and the largest tax reform in the U.S history. Currently the U.S. corporate tax rate is 35% and it is the highest among developed economies. President Trump also plans to simplify and reduce individual tax rate with the highest individual tax rate dropping to 25%.
The stock market has stalled lately after hitting a record on March 1 due to the worries about soft economic data, the absence of clarity on Trump’s policies, and concern over his failure to push through a healthcare bill. But then last Friday, Trump said he will reveal a “massive” tax package that will deliver cuts “bigger I believe than any tax cut ever.” His statement on Friday was further affirmed by a Saturday tweet
Trump Tax Cut Announcement
The plan however still faced a long road to enactment and signed into law, as the plan needs to get the approval by Congress and Democrats has expressed doubt about Trump’s plan as fiscally irresponsible. The plan still lacks on details on how to offset the reduced tax revenue, as budget experts believe that the tax cut could cost trillions of dollars in revenue in 10 years, ballooning the government debt. The stock market initial response was favorable and global indices gapped up on the Monday open on April 24. With the much-anticipated tax reform close to reality, investors are emboldened to chase stocks higher and the corporate-friendly tax rate adds upside momentum on the back of upbeat earnings season.
For us at EWF, we know before the news that indices still have more upside due to the bullish Elliott Wave sequence from Feb 2016 low, and we have been telling our members not to sell them and only buy the dips instead. With this latest rally to all-time high, we believe that the stock market rally could be entering the last leg of rally to end the cycle from Feb 2016 low. Let’s take a look at some U.S. stock markets below:
NASDAQ Daily Chart
Even before the news, we know that Nasdaq should extend higher as the Elliott wave sequence from Feb 11, 2016 low is showing a 5 swing bullish sequence, which favors more upside. After the news, Nasdaq gapped up then broke to new all-time high but we could see now that the cycle starting from Feb 11, 2016 low should reach extreme area in 7 swing at 6184 – 6455 area. This area could potentially end the cycle from Feb 11, 2016 and when that cycle is over, we could see a pullback in 3, 7, or 11 swing to correct cycle from Feb 11, 2016 low.
Overlay of NASDAQ, RUSSELL, and S&P 500
An overlay of the three Indices above shows the same cycle starting from Feb 11, 2016 low, which suggests that the biggest tax cut news could create the last leg rally to end cycle from Feb 11, 2016 before a pull back is seen in the Indices.
عضو المتداول العربي
NZDUSD Elliott Wave View: More downside
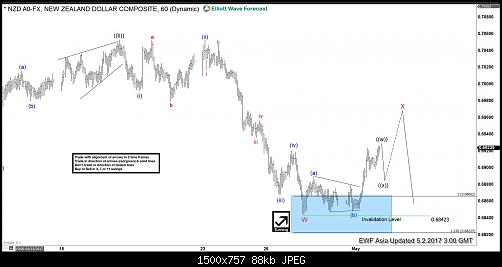
Short term Elliott Wave view in NZDUSD suggests the decline to 0.6844 low ended cycle from 3/21 high in Minor wave W. Pair is currently correcting cycle from 3/21 high in 3, 7, or 11 swing in Minor wave X before the decline resumes. The rally from 4/27 low (0.6844) looks to be unfolding as a double three Elliott Wave structure where Minute wave ((w)) is expected to complete soon as a Flat Elliott wave structure , then pair should pullback in Minute wave ((x)) to correct cycle from 4/27 low before turning higher again. We don’t like buying the proposed bounce and expect Minor wave X rally to find sellers in 3, 7 or 11 swing for more downside as far as pivot at 0.709 high remains intact.
NZDUSD 1 hour Elliott Wave Chart 05/02
عضو المتداول العربي
NZD USD Incomplete Elliott Wave Sequence
NZD USD is showing 5 swings down from 2/6/2017 (0.7375) which means it’s an incomplete Elliott wave sequence and calls for another swing lower to complete 7 swings down from 2/6/2017 (0.7375) peak. First 3 swings completed on 3/9/2017 (0.6886) and bounce to 3/21/2017 (0.7091) was the 4th swing. Pair has since made a new low below 0.6886 which means we have started the next cycle lower with a target of 0.6739 – 0.6589 and ideally 0.6607 – 0.6492 area.
We can see 5 swings down from 2/6/2017 peak on this chart (please note these are 5 swings which is not the same as a 5 wave Impulse). As we explained above, 5 swings means the sequence is incomplete and makes the sequence bearish against 0.7091 high as indicated by the red invalidation line and the red arrow. Proposed 6th bounce should stay below 0.7091 high and pivot for the pair to continue lower in 7th swing. Ideally 6th swing should stay below the descending trend line as well which is currently at 0.7018.
عضو المتداول العربي
Gold short term weakness likely
Gold to Silver Ratio Daily Elliott Wave Chart
Daily chart of Gold-to-Silver ratio above suggests that the ratio is correcting cycle from 2/29/2016 peak (83.68) before the decline resumes later, provided that pivot at 83.68 high stays intact. Short term, cycle from 7/4/2016 low (64.37) is showing a 5 swing incomplete sequence, favoring further upside in the short term. Expect the ratio to extend higher towards 76.55 – 78.68 area to end the rally from 7/4/2016 low, then it should at least pullback in 3 waves if not continue the next leg lower.
As the Ratio is inversely correlated with the underlying physical metals, this suggests that a higher ratio implies a lower XAUUSD and XAGUSD. Thus, we could expect short term weakness in both metals to persist until the Ratio reaches the target of 76.55 – 78.68, then when the Ratio turns lower, both metals can get support and start rallying also.
عضو المتداول العربي
NZDUSD Elliott Wave View: Correction in progress
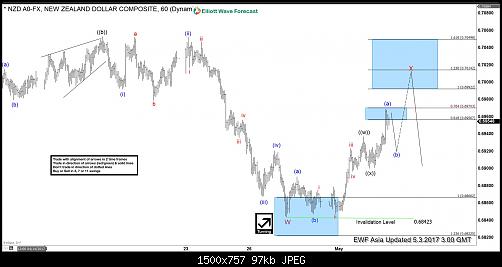
Short term Elliott Wave view in NZDUSD suggests the decline to 0.6844 low ended cycle from 3/21 high in Minor wave W. Pair is currently correcting cycle from 3/21 high in 7 or 11 swing in Minor wave X before the decline resumes. The rally from 4/27 low (0.6844) is unfolding as a double three Elliott Wave structure where Minute wave ((w)) ended at 0.6937 as a Flat Elliott wave structure , and Minute wave ((x)) pullback ended at 0.69. Near term, pair is correcting cycle from 0.69 low within Minutte wave (b) and while dips stay above there, expect pair to resume higher towards 0.699 – 0.7014 area before the decline resumes. We expect Minor wave X rally to find sellers at 0.699 – 0.705 area for an extension lower or at least a 3 waves pullback as far as pivot at 0.709 high remains intact.
NZDUSD 1 hour Elliott Wave Chart 05/03/2017
عضو المتداول العربي
USDCAD swings sequence calling the rally
Hello fellow traders. In this technical blog we’re going to take a quick look at the past Elliott Wave chart of USDCAD. In further text we’re going to explain the structure,count the swings and see how we foretasted the path.
USDCAD Elliott Wave 1 Hour Chart 04.27.2017
As our members know, we were pointing out that USDCAD is having incomplete bullish swings sequence from the 04/13 low . Structure has been calling for more strength in 7th swings once (x) blue pull back completes as Expanded flat. As far as short term pivot at 1.3406 low holds, the pair will be ideally targeting 1.3713 area. . At the chart below we can see that 6th swing is unfolding as expanded flat looking for 1.3526-1.34977 area to complete. Due to incomplete bullish sequences we recommended our members to avoid selling the pair, keep favoring the long side
USDCAD Elliott Wave 1 Hour Chart 05.02.2017
Eventually the pair has reached propose 50 fibs area at 1.35267 and completed (x) blue there as irregular flat structure. We got nice reaction higher. Currently approaching ideal target area at 1.3715-1.3788 and it’s already close to ending the cycle from the 04/13 low . Current price structure met minimum requirements already, and we should be careful chasing the strengths at this stage.
Keep in mind market is very dynamic and the view could have changed in a meant time.
عضو المتداول العربي
Nikkei Elliott Wave View: Ending impulsive 5 waves
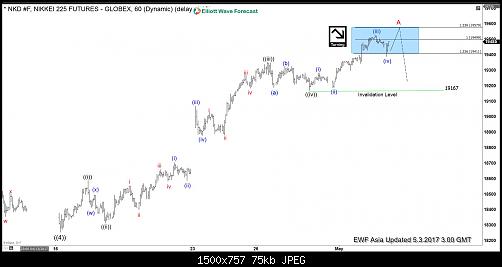
Short term Elliott Wave view in Nikkei ( NKD_F) suggests that the decline to 4/16 low (18255) ended primary wave ((4)). Up from there, the rally is unfolding as an impulse Elliott wave structure where Minute wave ((i)) ended at 18590, Minute wave ((ii)) ended at 18315, Minute wave ((iii)) ended at 19355, and Minute wave ((iv)) ended at 19170 low. Near term index has reached the minimum extension area in Minute wave ((v)) already, however another push higher towards 19579 area can be seen before index ends cycle from 4/17 lows in Minor wave A. Afterwards index is expected to see a pullback in 3, 7 or 11 swings within Minor wave B before further upside is seen. We don’t like selling the proposed pullback and expect buyers to appear again once Minor wave X pullback is complete in 3, 7, or 11 swing provided that pivot at 4/16 low (18255) remains intact.
Nikkei 1 Hour Elliott Wave Chart
عضو المتداول العربي
NZDUSD Elliott Wave View: Correction Ended
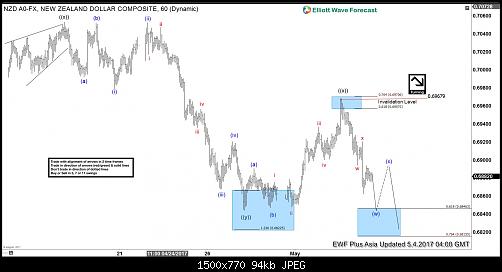
Revised Elliott Wave view in NZDUSD suggests the decline from 3/21 high (0.709) is unfolding as a triple three Elliott Wave structure where Minute wave ((w)) ended at 0.6905, Minute wave ((x)) ended at 0.7053, Minute wave ((y)) ended at 0.6844 and Minute second wave ((x)) is proposed complete at 0.6968. Minute wave ((z)) is in progress and unfolding as a double three Elliott Wave structure where Minutte wave (w) is expected to complete at 0.6815 – 0.6846 area, then it should bounce in Minutte wave (x) to correct cycle from 5/2 high before pair resumes lower again. We don’t like buying the pair and expect bounces in Minutte wave (x) to find sellers in 3, 7, or 11 swing provided that pivot at 0.6968 high remains intact.
NZDUSD 1 Hour Elliott Wave Chart 05/04/2017
عضو نشيط
hello mr alien Suh Dude
