PHP Warning: file_get_contents(): SSL operation failed with code 1. OpenSSL Error messages:
error:14077410:SSL routines:SSL23_GET_SERVER_HELLO:sslv3 alert handshake failure in ..../includes/arabictrader/blue_theme/at_latest_news.php on line 13
PHP Warning: file_get_contents(): Failed to enable crypto in ..../includes/arabictrader/blue_theme/at_latest_news.php on line 13
PHP Warning: file_get_contents(https://www.arabictrader.com/arabictrader_storage_server/live_json_feed/at_latest_news.json): failed to open stream: operation failed in ..../includes/arabictrader/blue_theme/at_latest_news.php on line 13
DFMGI has 5 swings bullish sequence from February 2016 low and currently while holding above last week low it should resume higher looking ideally for target area around 3978 - 4231 before a larger pullback can be seen.
.The index chart is very interesting so maybe I'll write an article about it later this week and shared with you
آخر تعديل بواسطة AlienOvichO ، 03-04-2017 الساعة 05:35 PM
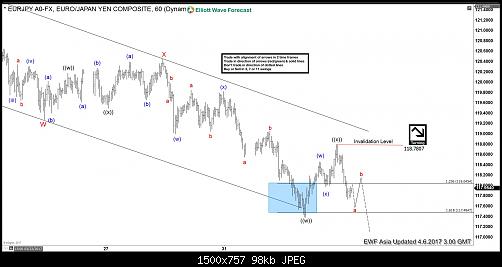
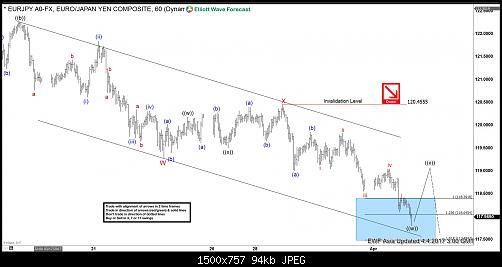
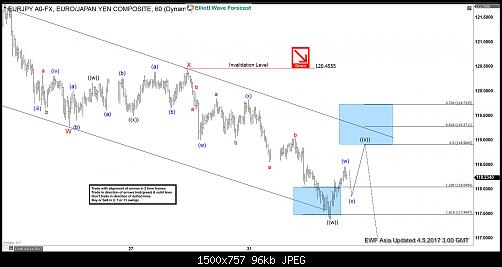
Short term Elliott Wave view in EURJPY suggests that cycle from 3/12 peak (122.89) is unfolding as a double three Elliott wave structure where Minor wave W ended at 119.28 and Minor wave X ended at 120.45. Minor wave Y is in progress and the internal is unfolding also as a double three Elliott wave structure where Minute wave ((w)) can be complete already at 117.8 and wave ((x)) bounce should correct cycle from 3/28 peak (120.445) before pair turns lower. As pair is showing a 5 swing bearish sequence from 3/12 peak as well as from 12/14/2016 peak, more downside is expected in the pair. We don’t like buying the proposed bounce and expect sellers to appear once wave ((x)) bounce is complete in 3, 7, or 11 swing provided that pivot at 3/28 high is intact in the first degree.
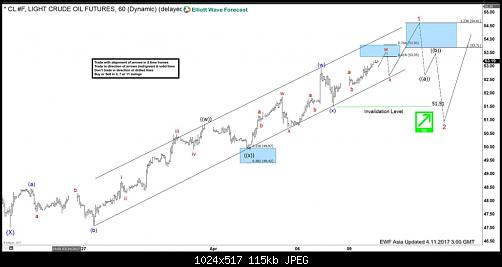
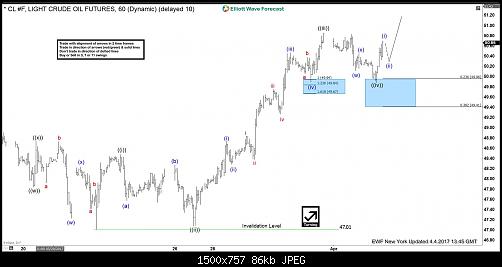
Crude Oil (CL_F) started rallying from 03/22 low in a bullish structure which still needs another leg higher to become 5 impulsive waves. The instrument ended the minute wave (( iv )) at the 23.6% Fibonacci retracement area 49.96 from which it managed to bounce higher to resume the move to the upside looking to reach the minimum target of minute wave (( v )) at the inverse 1.236 – 1.618 Fibonacci extension of minute wave (( iv )) that will be at 51.02 – 51.37 area. An other methods for calculating the 5th wave is by measuring (( v )) = (( i )) which gives us a target around the equal legs area at 51.27 – 51.61 and the last methods would be the 61.8 Fibonacci extension of waves (( i )) + (( iii )) that gives us a higher target around 52.19 area.
After ending 5 waves up, Crude Oil should make a 3 wave pull back and extend higher provided 5 waves up from 03/22 low is not part of an expanded FLAT. In either case, from one of the above mentioned area, we can see Crude Oil pulling back in 3 waves at least. We don’t like selling it even after wave ((v)) up has completed as we don’t pick tops or bottoms and instrument has a bullish 5 swings sequence in the daily chart also.
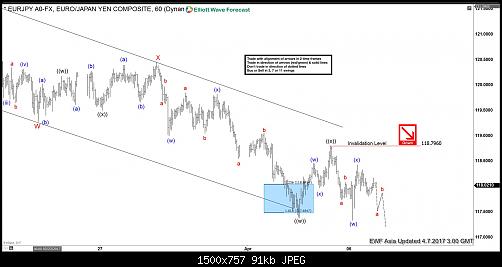
Short term Elliott Wave view in EURJPY suggests that cycle from 3/12 peak (122.89) is unfolding as a double three Elliott wave structure where Minor wave W ended at 119.28 and Minor wave X ended at 120.45. Minor wave Y is in progress and the internal is unfolding also as a double three Elliott wave structure where Minute wave ((w)) ended at 117.38 and wave ((x)) bounce is in progress to correct cycle from 3/28 peak (120.445) towards 118.9 – 119.72 area before pair turns lower. As pair is showing a 5 swing bearish sequence from 3/12 peak as well as from 12/14/2016 peak, more downside is expected in the pair. We don’t like buying the proposed bounce and expect sellers to appear at the above area once wave ((x)) bounce is complete in 3, 7, or 11 swing provided that pivot at 3/28 high stays intact in the first degree.
DFMGI has 5 swings bullish sequence from February 2016 low and currently while holding above last week low it should resume higher looking ideally for target area around 3978 - 4231 before a larger pullback can be seen.
.The index chart is very interesting so maybe I'll write an article about it later this week and shared with you
Millions of thanks
really very interesting and nice chart
if there's any possibility the current last wave C come ED or Interruption around 3700 ?
Short term Elliott Wave view in EURJPY suggests that cycle from 3/12 peak (122.89) is unfolding as a double three Elliott wave structure where Minor wave W ended at 119.28 and Minor wave X ended at 120.45. Minor wave Y is in progress and the internal is unfolding also as a double three Elliott wave structure where Minute wave ((w)) ended at 117.38 and Minute wave ((x)) bounce is proposed complete at 118.78. Down from 118.78, if pair can see 1 more minor low, the decline can be defined as 5 waves impulse and the 5 waves move should complete Subminutte wave a, then it should bounce in Subminutte wave b to correct the cycle from 118.78 high before pair turns lower again. We don’t like buying the proposed bounce and expect sellers to appear once Subminutte wave b is complete in 3, 7, or 11 swing provided that pivot at 4/5 high (118.78) stays intact in the first degree.
Millions of thanks
really very interesting and nice chart
if there's any possibility the current last wave C come ED or Interruption around 3700 ?
You are welcome
I'll publish later on an article about DFMGI and put 2 possible scenario with the most aggressive one starting with an impulse instead of an ABC because the index seems to have ended a bigger cycle so unless the moves truncates then it should extend higher.
DFMGI tracks Dubai Financial Market which is the largest financial trading exchange in the United Arab Emirates. Dubai has emerged as a global city and business hub of the Middle East , it’s contently growing bigger and becoming one of most expensive city in the world. The Dubai Financial Market (DFM) was founded on 2000, looking at it’s index chart you may say it’s quite different from the rest but we do believe in EWF that there is only one market and every instrument is related to another. Which explain having a different structure or sequence doesn’t necessarily mean that’s trading on it’s own, because the bigger cycles are the same among the different groups of the market.
DFMGI Elliott Wave View
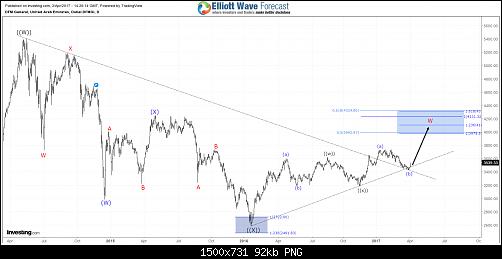
Last year, DFMGI rallied like the rest of world Indices and we can notice that it has a bullish structure in wave (1) unfolding as 5 impulsive waves from January 2016 low followed by a flat correction during the middle of the year in wave (2) and finally it managed to resume the rally from November lows to be make new high.
The index recently ended wave 2 pullback as a double three correction reaching equal legs area 3467 – 3423 from which it bounced higher and still needs to break above February peak to open more extension to the upside. The correction in wave 2 may persist if DFMGI manage to break 03/29 low but it should remain supported while the pivot at 3195 low keeps holding.
Zooming out to the weekly chart, we can notice that early this year DFMGI broke above the descending trend-line from 2014 peak which is confirming the bullish reversal started last year. Consequently if the Index manage to resume higher then the next target for the bulls would come around 4213 – 4840 area.
In case DFMGI holds below February peak and the pivot at November low gives up , then the Index could have ended the whole cycle from 2016 low and it will be looking to do a deeper correction toward the 50%-61.8 % Fibonacci area ( 3169 – 3034 ) before it can resume the move higher.
Recap:
DFMGI is one of the important Indices in the Middle East , its sharing the same cycle with the rest of world Indices and suggesting that there should be more upside to come if it manage to hold above November 2016 low. A deeper correction may happen but the Index will remain supported as it ended a corrective cycle and has a bullish structure in the bigger time frames.
Short term Elliott Wave view in EURJPY suggests that cycle from 3/12 peak (122.89) is unfolding as a double three Elliott wave structure where Minor wave W ended at 119.28 and Minor wave X ended at 120.45. Minor wave Y is in progress and the internal is unfolding also as a double three Elliott wave structure where Minute wave ((w)) ended at 117.38 and Minute wave ((x)) bounce is proposed complete at 118.79. Pair has resumed the decline lower and the decline is unfolding as a zigzag Elliott wave structure where Subminutte wave a ended at 117.33 and Subminutte wave b ended at 118.43. Near term, while bounces stay below 118.79, but more importantly below 120.45, expect pair to extend lower. We don’t like buying the proposed bounce.
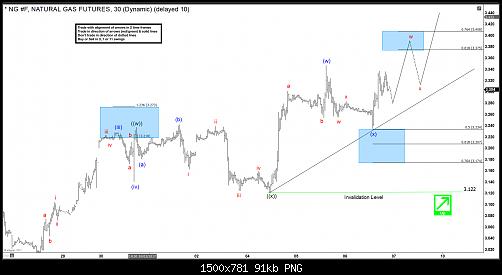
NG #F (Natural Gas) has been rallying since forming a low on 2/22 (2.523). Rally is unfolding as a WXY or double three Elliott Wave Structure where wave W completed at 3.089 and wave X completed at 2.882. Up from red X low, Natural Gas is showing 5 swings up which means the sequence is incomplete and while above black ((x)) low at 3.121, rally should continue higher towards 3.452 – 3.587 to complete 7 swings sequence from red X low. This would also complete a WXY structure from 2.523 low and then we should see a 3 wave pull back in NG #F either to correct the cycle from 2.523 low or at least from red X low.
NG #F (Natural Gas) 4 Hour Elliott Wave Chart
NG #F (Natural Gas) 1 Hour Elliott Wave Chart
Rally to 3.237 completed wave ((w)) which was followed by a FLAT correction to 3.121 which completed wave ((x)). Up from there, it rallied in 3 waves to 3.347 to complete wave (w) and then did a 3 wave pull back to 50 Fibonacci retracement level at 3.234 which we think completed wave (x). Today, Natural Gas started rallying again and now it needs to break above 3.347 (w) high to confirm wave (x) completed at 3.234 and wave (y) higher is in progress. Until 3.347 high doesn't break a test of 3.224 – 3.197 area can’t be ruled out to complete a double three correction in wave (x). Break above 3.347 would initially expose a test of 3.375 – 3.408 area and from there we can see another 3 wave pull back followed by the next leg higher towards 3.461 – 3.514 area which is the 100 – 123.6 Fibonacci extension area of (w)-(x) and will coincide with 100% Fibonacci extension of higher degree red W-X at 3.452.
Short term Elliott Wave view in EURJPY suggests that cycle from 3/12 peak (122.89) is unfolding as a double three Elliott wave structure where Minor wave W ended at 119.28 and Minor wave X ended at 120.45. Minor wave Y is in progress and the internal is unfolding also as a double three Elliott wave structure where Minute wave ((w)) ended at 117.38 and Minute wave ((x)) bounce is proposed complete at 118.79. Pair has resumed the decline lower and the decline is unfolding as a zigzag Elliott wave structure where Subminutte wave a ended at 117.33 and Subminutte wave b ended at 118.43. Near term, while bounces stay below 118.79, but more importantly below 120.45, expect pair to extend lower. We don’t like buying the proposed bounce.
EURJPY 1 Hour Elliott Wave Chart 04.07.2017
شكرا لكم AlienOvichO على هذا الموضوع هذا الزوج سجل قاع اليوم 117.05
هل ممكن التحديث؟
الجزء الاخير الذي تخيلته انت على الصورة هنا---تحقق بشكل دقيق تقريباً--على مواقع القدر
آخر تعديل بواسطة فيلسوف البادية ، 11-04-2017 الساعة 07:07 AM
Short term Elliott Wave view in Crude Oil (CL_F) suggests that cycle from 3/22 low (47.01) is unfolding as a double three Elliott wave structure where Minute wave ((w)) ended at 50.85 and Minute wave ((x)) ended at 49.88. Minute wave ((y)) is in progress and the internal is unfolding also as a double three Elliott wave structure where Minutte wave (w) ended at 52.94 and Minutte wave (x) pullback ended at 51.49. Near term, while pullbacks stay above 51.51, focus is on 53.71 – 54.61 area to complete Minor wave 1 and end cycle from 3/22 low, then Crude Oil should pullback in Minor wave 2 to correct cycle from 3/22 low before the rally resumes. We don’t like selling CL_F and expect buyers to appear once Minor wave 2 pullback is complete in 3, 7, or 11 swing for an extension higher.
شكرا لكم AlienOvichO على هذا الموضوع هذا الزوج سجل قاع اليوم 117.05
هل ممكن التحديث؟
الجزء الاخير الذي تخيلته انت على الصورة هنا---تحقق بشكل دقيق تقريباً--على مواقع القدر
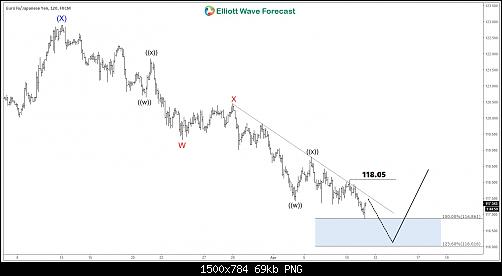
The pair reaching extreme area from 03/13 peak but while holding below yesterday's high 118.05 and below the trendline then can still add new lows into the 116.86 - 116.01 area before a bounce can be seen.
I can only share specific charts from time to time to respect our client privilege but you can contact me privately for specific details


 الأكثر زيارة

 رد مع اقتباس


 عضو المتداول العربي
المشاركة الأصلية كتبت بواسطة AlienOvichO