
المشاركة الأصلية كتبت بواسطة 3ammary

ممكن حد يشرح لنا كيفية انشاء هذه الموجه؟؟؟
الشرح هنا بس مش فاهم منه كتير
Any object vibrating will produce a wave as a function
of time. That is to say, all vibration produces a wave
form . . . momentum up . . . momentum down. Price
vibration in the market produces a consistent wave with
a wavelength (period) of 26.
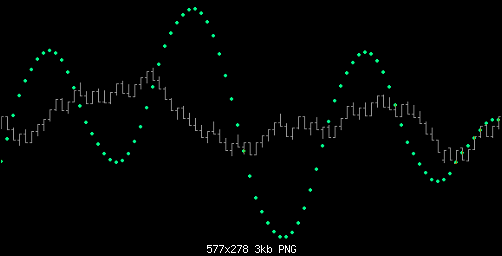
While it could be argued by some that the wavelength of
market vibration is 27, this is actually a moot point
since in real-world application the wave ranges on
average from slightly less than 26 to slightly more
than 26. The pertinent point is that no matter how you
formulate the underlying wave generated by price
vibration . . . the wavelength comes out to be 26.
Consequently, this simple fact will serve to reveal the
Phi structure so ubiquitous in vibration.
In practice one will observe that while the wave form
of price vibration is pretty consistent in its length
of 26, what is of interest is that wave divergences
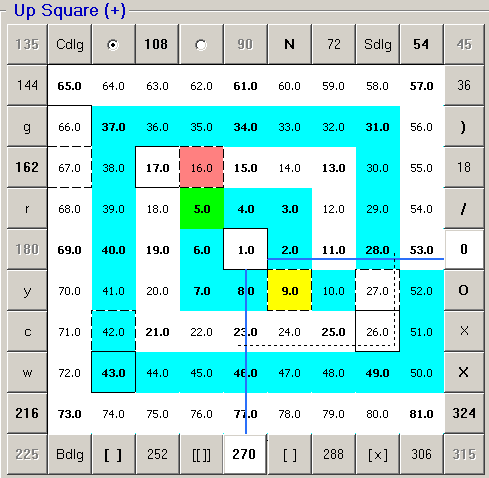
from 26 will predominantly fall in the 270* to 360*
quadrant of the “Square of 9“. Specifically in the 180*
(or 2nd) wrap as shown below.
So price vibration over time yields a price/time
‘momentum’ wave. The discriminating factors are:
(1) Price Square Range
(2) Price Square Factor
-----------------------------
‘Price Square Range‘_Range of price bar (in ticks)
squared. Example: range of price bar = 10 ticks, square
= 100
‘Price Square Factor‘_Range in degrees above/below the
price square range of the chart. Example: Range of
chart = 10, 270* above is 13. (Note: 270* = a square
root factor of 3 and is a key component in vibrational
analysis)
-----------------------------
Using a ‘Square of 9′ formulation and applying ‘price
square factors’ of +/- 90 to 360* produces consistent
cycle duration (wavelength) of 26 bars. Certainly it is
non-linear, which is beautiful, but on average . . . 26
bars.


 الأكثر زيارة


 رد مع اقتباس


 عضو المتداول العربي
