

 الأكثر زيارة

 رد مع اقتباس


عروض شركات الفوركس
 | |  | |  |  |  |

 عضو المتداول العربي
ES_F Index Elliott Wave: Resuming Higher
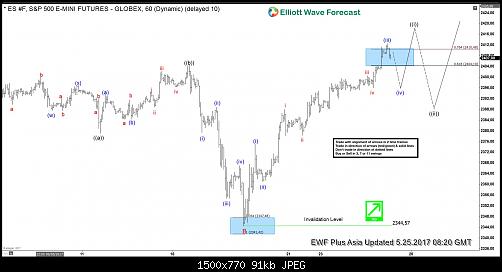
Short Term Elliott Wave view in ES_F Index suggests the rally to 2403.75 ended Minor wave A. Minor wave B unfolded as an Expanded Flat Elliott Wave structure where Minute wave ((a)) ended at 2379, Minute wave ((b)) ended at 2404.5, and Minute wave ((c)) of B ended at 2344.5. After ending the pullback, the Index started a new leg higher and the rally from 2344.5 low looks to be unfolding as a 5 waves Elliott Wave impulse structure where Minutte wave (i) ended at 2375, Minutte wave (ii) ended at 2361, and Minutte wave (iii) is proposed complete at 2411.25. Expect Minutte wave (iv) pullback to commence soon to correct cycle from 5/19 low before turning higher one more time to end Minutte wave (v). This last push higher will also complete larger degree Minute wave ((i)).
Once Minute wave ((i)) is complete, the Index should pullback within Minute wave ((ii)) in 3, 7, or 11 swing to correct cycle from 5/18 low (2344.7) before the rally resumes again. As the Index has broken above the previous peak at 2404.5, it gives more conviction that the Index has started the next leg higher and thus pullback can likely hold above 2344.7 for more upside. We don’t like selling the proposed pullback and expect buyers to appear again once Minute wave ((ii)) pullback is complete at later stage, provided that pivot at 2344.7 low remains intact.
ES_F Index 1 Hour Elliott Wave Chart
عضو المتداول العربي
ES_F E-Mini S&P500 Elliott Wave: Ending wave (iii)
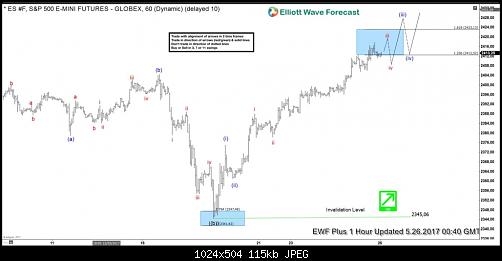
Short Term Elliott Wave view in ES_F E-Mini S&P500 suggests the rally to 2403.75 ended Minor wave A. Minor wave B unfolded as an Expanded Flat Elliott Wave structure where Minute wave ((a)) ended at 2379, Minute wave ((b)) ended at 2404.5, and Minute wave ((c)) of B ended at 2344.5. After ending the pullback, the Index started a new leg higher and the rally from 2344.5 low looks to be unfolding as a 5 waves Elliott Wave impulse structure where Minutte wave (i) ended at 2375, Minutte wave (ii) ended at 2361, and Minutte wave (iii) remains in progress and can reach 2423.13 or 161.8% fibonacci extension of Minutte wave (i). Expect Minutte wave (iv) pullback to start once Minutte wave (iii) is over before turning higher one more leg in Minutte wave (v). This last push higher will also complete larger degree Minute wave ((i)) and as impulse, it should be accompanied with momentum divergence.
Once Minute wave ((i)) is complete, the Index should pullback within Minute wave ((ii)) in 3, 7, or 11 swing to correct cycle from 5/18 low (2344.7) before the rally resumes again. As ES_F E-Mini S&P500 has broken above the previous peak at 2404.5, it gives more conviction that the Index has started the next leg higher and thus pullback can likely hold above 2344.7 for more upside. We don’t like selling the proposed pullback and expect buyers to appear again once Minute wave ((ii)) pullback is complete at later stage, provided that pivot at 2344.7 low remains intact.
ES_F E-Mini S&P500 1 Hour Elliott Wave Chart 05/26/017
عضو المتداول العربي
GBPJPY Elliott Wave: Downside Has Resumed
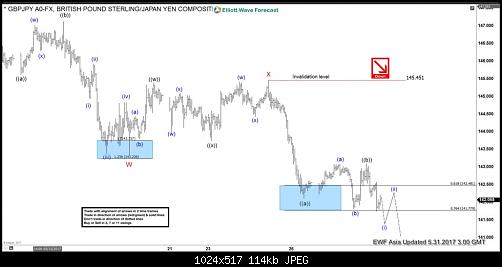
Short Term GBPJPY Elliott Wave view suggests the decline from 5/10 peak is unfolding as a double three Elliott Wave structure where Minor wave W ended at 143.33 and Minor wave X ended at 145.45. The subdivision of Minor wave W unfolded as a zigzag Elliott Wave structure where Minute wave ((a)) ended at 145.61, Minute wave ((b)) ended at 147.12, and Minute wave ((c)) of W ended at 143.33. After ending Minor wave X at 145.45, pair has since resumed lower and broken below 143.33. This creates a bearish 5 swing incomplete sequence from 5/10 peak and favors more downside in the near term.
GBPJPY Elliott Wave structure of the decline from 145.45 looks to be in a zigzag where Minute wave ((a)) ended at 142.11 and Minute wave ((b)) is proposed complete at 143.09 as a Flat Elliott Wave structure. Pair has broken below 141.81 irregular Minutte wave (b) which suggests that Minute wave ((c)) lower has already started. Near term, while bounces stay below 143.09 in the first degree, but more importantly below 5/25 high (145.45), expect pair to continue lower towards 139.51 – 140.65 area before cycle from 5/10 peak ends. Buyers should then appear from the aforementioned area for an extension higher or at least a 3 waves bounce. We do not like selling the proposed move to the downside.
GBPJPY Elliott Wave 1 Hour Chart 05/31/2017
عضو المتداول العربي
Are the World Indexes close to a Huge peak?
Since the correction between the year 2000 and 2009, many traders around the world have developed an idea of bearish World Indexes with more downside to come. With Fed driving Market, everyone is under the idea that Global Indexes are inflated and will crash again resulting in another decline like the one seen in 2008. Traders, first of all, need to understand that the Market does not move in a straight line, it has never moved in a straight line and never will, consequently correction in different degrees always will take place. It is understandable that the biggest correction we have seen so far was the one that happened between 2000-2009 and someday a correction even bigger that that will happen. It is important to understand that corrections are needed, otherwise there would be no losers and no profit takers. We believe that the Indexes trend will always be Bullish in the Century and Yearly time frames and will do corrections in weekly, monthly and even yearly degree at one stage. We follow all Indexes around the World and apply a system in which we ride the trend is over and market said correction has started and then, we locate the degree and we adjust the counts according to the degrees. We use Elliott wave Theory to count the waves and gather directions, also to explain our ideas to members and followers, but we use several other tools like correlations, sequences, cycles, time and distribution to increase accuracy of our forecasts.
In 2015, we knew it was time for a correction in Daily Time frame and we warned members and followers about it. Read this blog $NIFTY reaching a Warning area for Indexes Bulls and see how the $NIFTY from India was the one that called the extreme in time and price and we knew that was the time for the World Indexes to make a daily correction and pull back in 3 swings at least or extend into 7 or 11 swings. However, at that moment, we also knew that the dip was another chance to buy into the all-time 100% in most World Indexes. Now the World Indexes are not yet at risk of another major peak and any dips should still be considered another chance to buy in 3, 7 or 11 swings.
FTSE Swing sequence from the All Time Low
Since the all-time low and following the sequences in 3 different degrees Black/ BLUE /RED, it is clear that Price has not yet reached the 100% Fibonacci extension area between 9109-10000 area and neither time has matched the 1=3 in RED degree, nor 1 Blue = 3 Blue within RED 3. the idea is that soon, market will pull back in 2 BLACK within 3 Blue but still both price and time are calling for stronger Indexes into the years 2022-25 and that’s when there would be a chance of a nice correction either to correct the cycle from 2009 low i.e. 3 RED or the whole cycle since 0 RED. By then, we will get a perfect hit of 3-3-3 and the Index should be ready for at least a Weekly correction. As we mentioned earlier, a big Illusion has been created that a huge Crash needs to happen in the World Indexes but the Reality is that someday a big correction will happen, but picking tops against a clear Bullish trend it is not the right trade. In 2022 the time will be equal from 2009-2015 and 2016 to 2022 which will be equal cycles of 6 years and also if price has reached the 1=3 RED and then 1=3 in BLUE, there will be chance of weekly correction to take place in the World Indexes, until then our strategy remains to buy the dips in 3, 7 or 11 swings and not pick the tops.
عضو المتداول العربي
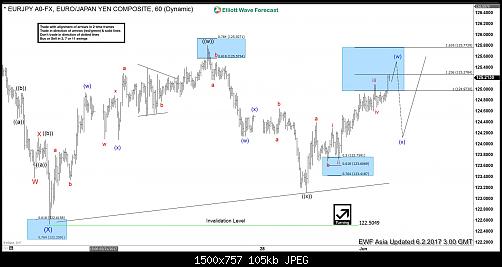
EURJPY Elliott Wave: Bullish against May 30th low
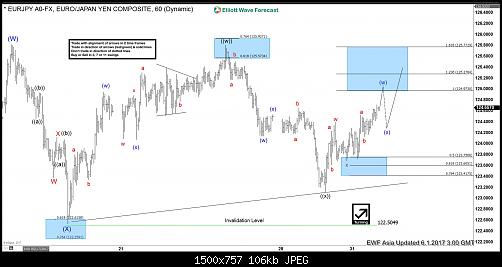
Short Term EURJPY Elliott Wave view suggests the rally from 4/16 low is unfolding as a double three Elliott Wave structure. Up from 4/16 (114.8) low, Intermediate wave (W) ended at 125.81 and Intermediate wave (X) ended at 122.53. A break above 125.81 however is still needed to add conviction that the next leg higher has started.
From 122.53 low, the rally is also unfolding as a double three Elliott Wave structure. Minute wave ((w)) ended at 125.8 and Minute wave ((x)) ended at 123.11. Near term, while pullbacks stay above 123.11, expect pair to extend higher. If pair breaks below 123.11, then pair is likely doing a double correction from 5/16 peak. This suggests pair can open extension lower to 121.6 – 122.25 area in case of a double correction. From this area, buyers should appear again for an extension higher or at least a 3 waves bounce. We do not like selling the proposed move to the downside and expect dips to find buyers in 3, 7, or 11 swing.
EURJPY 1 Hour Elliott Wave Chart 06/01/2017
عضو المتداول العربي
OPEC Meeting and Impact on Crude Oil
OPEC ended its highly anticipated meeting on Vienna last Thursday to discuss about extending the production cut in Crude Oil. They have decided to extend the current agreement to cut production output by 1.8 million barrels per day by 9 more months to stabilize oil price. Oil prices plunged by more than 5 percent after the decision.
Source: CNBC
Prior to the meeting, almost all of the oil ministers from OPEC and Non OPEC participants have suggested a 9-month production cut extension. This means that the production cut will run until March 2018. Saudi Arabia and Russia have both verbally consented to the extension even before the meeting began. Since they represent the biggest OPEC and Non-OPEC member, this outcome has largely been priced in by the market.
However, market was anticipating further surprise from the meeting such as a deeper and more aggressive production cut. Investors had hoped for further output cut to drain the global glut which depressed oil’s price for almost three years. As the decision outcome only meets the market expectation, disappointed investors ran for an exit following the meeting.
Despite the short term knee-jerk reaction, typical of “buy rumors, sell the facts”, the outlook on Oil prices remain constructive in longer term. The production cuts should help accelerate inventories draw down for the remainder of the year and could set a new floor for Crude Oil price. OPEC also discussed extending the production cuts through June 2018 if the price of Oil keeps falling. Their decision will be reviewed near the end of the nine-month extension.
The Joint Ministerial Monitoring Committee (JMMC) which was established last December to watch the compliance of the production cut, said that OPEC and NOPEC compliance exceeded expectation at 102%. Saudi Arabia has cut production by 553,000 barrels per day, which is 14% higher than their commitment. Due to the budget deficit, Saudi Arabia as the largest member appears committed to stabilizing Oil price. This is contrary to their previous strategy of flooding the market with Oil to drive out U.S. shale companies. With OPEC members determined to support Oil’s price, a higher price floor above Feb 2016 low ($26.05) has likely been established. There are two possible buying areas for Crude Oil’s dip buyers.
Crude Oil Bullish Scenario #1
In the first scenario above, Crude Oil is doing a symmetrical triangle consolidation since June 2016. It is bullish against 5.5.2017 low ($43.76) in the first degree. If pivot at $43.76 holds, then buyers may appear after 3 swing pullback at 45.56 – 46.46 area for an extension higher or a 3 waves bounce.
Crude Oil Bullish Scenario #2
In the second scenario above, Crude Oil is correcting the entire cycle from 2.1.2016. This correction should unfold in 7 swing and become the next option if pivot at 5.5.2017 low ($43.76) fails. The next buying area in the 7th swing extreme area is at 38.02 – 40.71. Buyers should appear in this area for either a new high or at least a 3 waves bounce.
As the market is dynamic, traders need to keep up with the most up-to-date analysis of their favorite instrument. Successful traders need to have a good trading system and also strict risk management with rules that define entry, stop loss, and take profit levels with high accuracy to allow traders to get into a risk free position in your trade as quickly as possible
عضو المتداول العربي
EURJPY Elliott Wave: Short term Pullback
Short Term EURJPY Elliott Wave view suggests the rally from 4/16 low is unfolding as a double three Elliott Wave structure. Up from 4/16 (114.8) low, Intermediate wave (W) ended at 125.81 and Intermediate wave (X) ended at 122.53. A break above 125.81 however is still needed to add conviction that the next leg higher has started.
From 122.53 low, the rally is also unfolding as a double three Elliott Wave structure. Minute wave ((w)) ended at 125.8 and Minute wave ((x)) ended at 123.11. Near term, cycle from 5/30 low (123.11) is mature and expected to end soon. This cycle from 5/30 low is unfolding as a Flat Elliott Wave structure and expected to end with Minutte wave (w) at 125.5 – 125.7 area. Once Minutte wave (w) is over, expect pair to pullback in Minutte wave (x). The pullback should unfold in 3, 7, or 11 swing and while the pullback stays above 123.11, pair should extend higher. If pair breaks below 123.11, then pair is likely doing a double correction from 5/16 peak. This suggests pair can open extension lower to 121.6 – 122.25 area in case of a double correction. From this area, buyers should appear again for an extension higher or at least a 3 waves bounce. We do not like selling the proposed move to the downside and expect dips to find buyers in 3, 7, or 11 swing.
EURJPY Elliott Wave 1 Hour Chart 06/02/2017
عضو المتداول العربي
Ethereum showing Elliott Wave path for Bitcoin
Ethereum is an open-source blockchain-based distributed computing platform featuring smart contract functionality. It provides a decentralized Turing-complete virtual machine, the Ethereum Virtual Machine (EVM), which can execute scripts using an international network of public nodes. Ethereum also provides a crypto-currency token called “ether”, which can be transferred between accounts and used to compensate participant nodes for computations performed.
Ethereum went live in 2015, it quickly gained attraction in the digital world and it’s currently the second largest Crypto-Currency with 20 Billion Dollar in market cap surpassing Ripple (11 Billion) and sitting behind the Bitcoin (39 Billion). Since the start of 2017 , all the digital currencies doubled its value after after prices kept rising higher in the recent months and buyers all over the world jumping in to take a piece of the rally.
Looking at the some daily charts of the digital coins, you’ll probably see a parabolic curve to the upside which may seems hard to catch any trade. However using our swing sequences and following the trend which is clearly bullish as the instrument keeps making higher highs then buying the pullbacks in 3 , 7 or 11 swing was the right way to catch every dip during the recent rally.
Let’s take a look at the lower time frame chart of Ethereum and Bitcoin and explore the potential scenarios.
Ethereum: ETHUSD 4H Chart 05/31/2017
Ethereum saw a 50% decline from 05/25/2017 peak which may caused a lot of fear around the market, but looking at the technical picture the correction came after a 5 waves move from the lows and that why it was another great opportunity to buy ETHUSD after 3 waves zigzag pullback into the equal legs area 136 – 104. The instrument already rallied from the inflection area and managed to make a new all time highs opening a new extension to the upside toward ideally 315 – 365 area. In the shorter term, a pullback from 225 – 250 can be seen against 110 low but it can be just a shallow 3 waves pullback before Ethereum resumes the rally again as it has an incomplete bullish sequence.
BITCOIN: BTCUSD 1H Chart 05/31/2017
The same thing happened for Bitcoin which saw a 65% correction from 05/25 peak which unfolded as a double three structure and managed to finish the 7th swing around the equal legs area 2055 – 1720. The reaction from that area wasn’t strong enough to break to new high like the case of Ethereum but BTCUSD created a short term incomplete bullish sequence from 05/27 low which could take it toward equal legs area 2652 – 2771 before another pullback is seen. Bitcoin still needs to break the previous peak to open a new extension highs that can take it another $1000 higher. However if it fails to make new highs then there is still the possibility for a double correction which will represent another opportunity to buy it again.
Recap
Ethereum is the one leading the move for the rest of crypto-currencies as ETHUSD already made new all time highs and opened the door for another leg to the upside, which means Bitcoin should ideally follow the same path even it’s currently still lagging the equivalent move.
Buying crypto-currencies is the hot theme for 2017, investors has already added different types of digital coins to their portfolio and traders are trying to catch the long side of the rally. However there is huge volatility with these kind of instrument which causes sharp declines in few hours that can trick short term traders and may cause a lot of problem. That’s why unless you are owning these crypto-currencies from lower levels and looking to hold it for a long time then it’s better to pay attention to the market structure and learn how identify the right sequence and cycle to allow you to buy it the right area to protect you trade after the first reaction.
عضو المتداول العربي
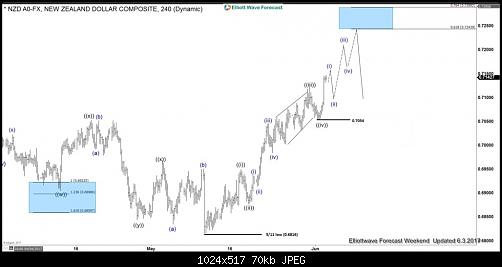
NZDUSD Elliott Wave View: Showing impulse
Short term Elliott wave view in NZDUSD suggest that the cycle from 5/11 low (0.6816) is unfolding as an impulsive Elliott wave structure . This 5 wave move could be a wave C of a FLAT correction or wave A of an Elliott wave zigzag structure structure. In either case, after 5 wave move ends, pair should pull back in 3 waves at least as the Elliott Wave Theory suggests. The Minute wave ((i)) ended at (0.6948), Minute wave ((ii)) pullback ended at (0.6880), Minute wave ((iii)) at 0.7121 peak, Minute wave ((iv)) pullback ended at (0.7054) low. Above from there Minute wave ((v)) of C or A already reached the minimum extension area in between inverse 1.236-1.618% extension area of previous wave ((iv)) already at 0.7135-0.7161 area. Which means cycle from 5/11 low (0.6816) is mature and pair can start the 3 waves pullback at any moment.
However as far as dip remains above wave ((iv)) dip (0.7054) & more importantly while the Rsi divergence at the peak stays intact pair may see further advance towards ((v))=((i)) target area at 0.7186-0.7217 area or in case of further strength pair may see 0.618-0.764% fibonacci Extension area of wave ((i))+((iii)) at 0.7243-0.7289 before ending the 5 waves impulse sequence from 5/11 low. Afterwards pair should pullback in 3, 7 or 11 swings for the correction of 5/11 cycle or If the decline turns out to be stronger than expected and breaks the pivot at 5/11 low (0.6816) then that would suggest 5 wave move up from 0.6816 low was part of a wave C of a FLAT from 3/09 (0.6889) low and pair may resume lower.
NZDUSD 4 Hour Elliott Wave Chart
عضو المتداول العربي
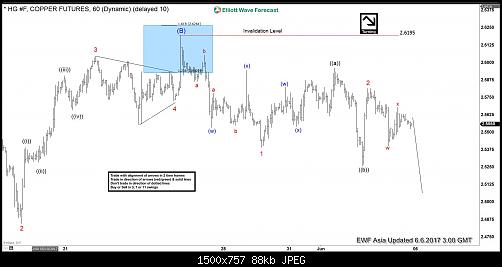
HG#F (Copper) Elliott Wave View: Extension lower
HG#F (Copper) is showing 5 swings incomplete sequence from 2/13/2017 high, preferred Elliott wave view suggests rally to 2.619 completed 6th swing as a FLAT in wave (B) and metal has now resumed the decline in 7th swing. Decline from 2.619 is so far corrective so wave (C) is expected to take the form of an Ending diagonal where wave 1 ended at 2.539 and wave 2 ended at 2.581 as a FLAT. Near-term focus is on 2.526 – 2.500 area to complete 3 waves from wave 2 peak, this area can result in a bounce in 3 waves again which should fail below 2.581 high and more importantly below 2.619 high for extension lower towards 2.376 – 2.2716 area to complete 7 swings from 2/13/2017 high.
HG#F (Copper) 1 Hour Elliott Wave Chart 06/06/2017
عضو المتداول العربي
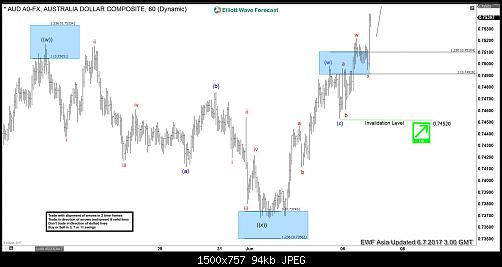
AUDUSD Elliott Wave View: More Upside
Short Term Elliott Wave view in AUDUSD suggests the rally from 5/9 low is unfolding as a double three Elliott Wave structure. Up from 5/9 (0.7325) low, Minute wave ((w)) ended at 0.7517 and Minute wave ((x)) ended at 0.7368. Pair has since broken above 0.7517, adding validity that the next leg higher has started.
From 0.7368 low, the rally is also unfolding as a double three Elliott Wave structure. Minutte wave (w) ended at 0.7498 and Minutte wave (x) ended at 0.7453. Near term, while pullbacks stay above 0.7452, but more importantly as far as pivot at 0.7368 stays intact, expect pair to extend higher towards 0.756 – 0.7607 area to end cycle from 5/9 low. We don’t like selling the pair and expect buyers to appear in any dips in 3, 7, or 11 swing provided that pivot at 0.7368 remains intact.
AUDUSD 1 Hour Elliott Wave View
عضو المتداول العربي
ZN (10 Year Treasury Note) and SPX
Many traders around the World keep picking the top in Indices and fail to capitalise on the trend which is to the upside. Recently, we did a blog to explain World Indices could see another huge peak around 2020 – 2022, of course there would be corrections in between but they should offer nothing more than a buying opportunity in the sequence of 3, 7 or 11 swings. Advantage of trading with technique is that even when the trend is extreme, you are trading with a defined risk and get a chance to eliminate risk on the trade as the market bounces from extreme areas after 3 swings, 7 swings or 11 swings. In this video we explain the relationship between ZN (10 Year Treasury Note) and SPX.
ZN (10 Year Treasure Note) and SPX Overlay
Above chart shows ZN (10 Year Treasury Note) has ended the cycle from 2007 low and most likely from 2000 low as well and as far as bounces fail below 2016 and more importantly below 2012 peak, 10 year note prices can drop towards 117 – 114.19 area to finish correcting 2000 cycle and then turn higher again for another monthly cycle or make a larger 3 waves bounce at least. We can see in the above chart that 10 year note formed a peak in 2012 and dropped and SPX rallied. Then we saw another secondary peak in 10 year note in 2016 which was a low in SPX and caused another rally. While below 2016 peak, 10 year note prices should drop further and that should cause SPX rally to extend and it could reach as high as 3133 area by the year 2020 – 22. Therefore, we don’t like picking the tops in Indices and expect buyers to appear in the dips after 3, 7 or 11 swings. When 10 year note prices reach 117 – 114.19 area, Indices would have a chance to form a huge peak and start a larger pull back and that should be a good time to buy 10 year T-note.
عضو المتداول العربي
Nifty-NSE: Next Warning area for bulls
In June 2015, we mentioned that Nifty-NSE from India was in a warning area for the bulls and a larger correction was expected to take place. Over the next 12 months, Nifty lost 25% dropping from a high of 9119.20 on 3.4.2015 to a low of 6825 on 2.29.2016. However, as we keep mentioning World Indices trend remains up and dips are nothing more than buying opportunity in the right areas, so this dip in this Indian Index was another buying opportunity in the blue box between 7459 – 6721.
Nifty-NSE buying area down from 3.4.2015 peak
Index found buyers in the blue box shown on the chart above and rallied. Index has already made a new high above 9119.20 (3.4.2015) and has opened the next bullish extension. Index is currently showing an incomplete Elliott wave sequence up from 2.29.2016 low which calls for dips to find buyers in the sequence of 3, 7 or 11 swings for extension higher.
Nifty-NSE 10053 – 100562 is next warning area for bulls
Index is showing an incomplete Elliott wave sequence which means dips should remain supported for more upside. As dips hold above 5.24.2017 low and more importantly above 4.19.2017 low, expect the Index to find buyers in the dips in 3, 7 or 11 swings for extension higher towards 10053 – 10562 area. This area is close to the upper channel line as well and could contain the rally in the Index or at least slow it down. This means bulls should stay in control in rest of the Indices also like $SPX $INDU $FTSE $DAX $NASDAQ and $IBEX etc until Nifty doesn’t reach the above mentioned area. From 10049 – 10557 area, we can see a larger 3 waves pull back in the Nifty to correct the cycle from 2.29.2016 low or at least from 12.26.2016 low.
عضو المتداول العربي
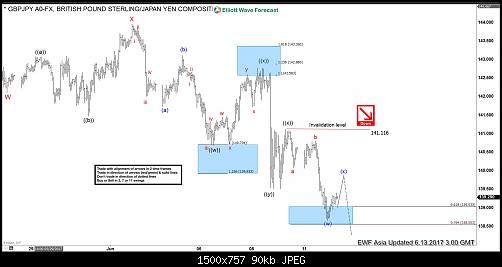
GBPJPY Elliott Wave Analysis: Extension Lower
Short term GBPJPY Elliott Wave view suggests the decline from 5/10 high shows a 5 swing sequence, thus favoring more downside. Decline from 5/10 high is unfolding as a double three Elliott Wave structure. Down from 5/10 peak (148.11), Minor wave W ended at 141.47 and Minor wave X ended at 143.96. Minor wave Y is currently in progress and has scope to retest 4/16 low (135.58). Support can be seen at 135.7 – 137.3 area for at least 3 waves bounce.
Subdivision of Minor wave Y is proposed to be unfolding as a triple three Elliott Wave structure. Down from 6/1 peak (143.96), Minute wave ((w)) ended at 140.68, Minute wave ((x)) ended at 142.77, Minute wave ((y)) ended at 139.52 and Minute second wave ((x)) ended at 141.11. Near term, while Minutte wave (x) bounce stays below 141.11, and more importantly below 143.95, expect pair to extend lower. We don’t like buying the proposed bounce.
GBPJPY 1 Hour Elliott Wave Chart 06/13/2017
عضو المتداول العربي
Can Ripple catch the rally of Bitcoin & Ethereum
Ripple is the third-largest cryptocurrency by market capitalization, after Bitcoin and Ethereum. It’s distributed financial technology allows banks to efficiently settle transactions in real time. An alternative to today’s global payment infrastructure, Ripple eliminates time delays and ensures certainty of settlement, resulting in lower transaction costs for banks and their customers and unlocking new revenue opportunities.
Since the start of 2017, crypto-currencies dominated the global market with huge gains and every trader / investor is buying these assets or looking to exchange it against each other . We pointed out last year to the potential rise of Bitcoin and recently explained how Ethereum is leading the move to the upside, but Ripple has been lagging the recent move so let’s see if it will be able to catch up .
XRP is the native currency of ripple and only exists within the network, so we’ll be using XRP/USD and compare it to both BTCUSD & ETHUSD.
XRPUSD had a significant peak on 05/17 and then dropped for 70% before placing a low on 05/27 same as the rest of crypto-currencies. Since then Ripple only saw a shallow bounce before staying sideways to lower, while ETHUSD saw an impressive +200% increase in value compared to +45% for Bitcoin.
Ripple Elliott Wave Technical Chart
Despite the 40% drop since June the 1st , XRPUSD is reaching a short term extreme area at equal legs ( $0.2324 – $0.1893 which will provide a floor as buyers are expected to show up for a 3 waves bounce at least from there. The Instrument already ended a double three correction at 05/27 low ( $0.1190 ), so while the instrument stays above that level then it should be able to rally for new all time highs with a minimum target at $0.55 area.
Recap
The Ripple protocol has been increasingly adopted by banks and payment networks as settlement infrastructure technology , it’s system have a number of advantages over other cryptocurrencies, that’s why it’s being used by companies such as UniCredit, UBS & Santander. So the digital coin looks to have a bright future as it will be implemented in the financial system and despite its current low price it can catch up the move to the upside really quickly.
