الأكثر زيارة

 رد مع اقتباس


عروض شركات الفوركس
 | |  | |  |  |  |

 عضو المتداول العربي
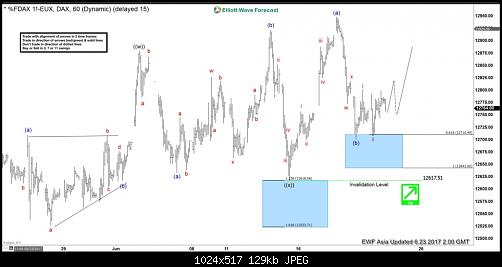
DAX Elliott Wave Analysis: Rally expected
Short term DAX Elliott Wave view suggests the rally from 5/18 is unfolding as a double three Elliott Wave structure. Minute wave ((w)) ended at 12879.5 and Minute wave ((x)) pullback ended at 12617. Internal of Minute wave ((x)) subdivided as an expanded flat Elliott Wave structure where Minutte wave (a) ended at 12633.5, Minutte wave (b) ended at 12922.5 and Minutte wave (c) of ((x)) ended at 12617. DAX has broken above Minutte wave (b) on 6/14, adding conviction that the next leg higher has started. Up from 12617, the rally is unfolding as a zigzag Elliott Wave structure where Minutte wave (a) ended at 12948.5 and Minutte wave (b) is proposed complete at 12701.5. Near term, while pullbacks stay above 12701.5, and more importantly above 12617, expect Index to extend higher. We do not like selling the Index.
DAX 1 Hour Elliott Wave Chart 06/23/2017
عضو المتداول العربي
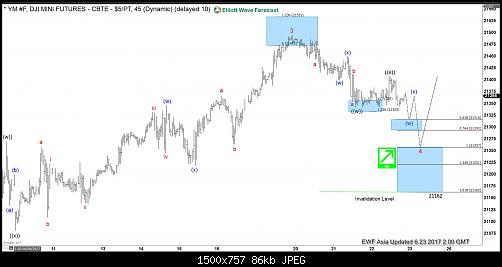
DJI Futures Elliott Wave Analysis: Pull back in progress
Short term YM (DJI Futures) Elliott Wave view suggests the rally from 4/19 low is unfolding as a diagonal Elliott Wave structure where Minor wave 1 ended at 21010 (4/26), Minor wave 2 ended at 20474 (5/18), Minor wave 3 ended at 21494 (6/19). Minor wave 4 is in progress and subdivided into a double three Elliott Wave structure. Down from 6/19 peak, Minor wave 4 is expected to do 7 swings and reach 21257 – 21221 area. Index should then resume the rally looking for new highs or bounce in 3 waves at least. We don’t like selling the proposed pullback and expect buyers to keep appearing at extremes in the sequence of 7 or 11 swings as far as pivot at 5/18 (20474) low remains intact in the first degree and 4/19 (20311) low remains intact in the second degree.
YM (DJI Mini Futures) 1 Hour Elliott Wave Chart 06/23/2017
عضو المتداول العربي
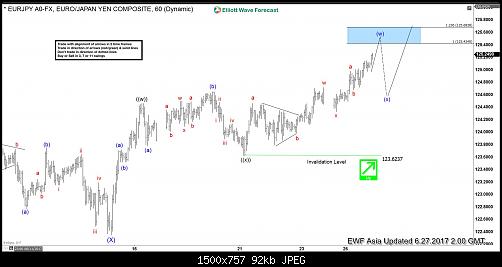
EURJPY Elliott Wave Analysis: Bullish against 123.6
Short term EURJPY Elliott Wave view suggests the decline to 122.35 on 6/15 low ended Intermediate wave (X). Rally from there is unfolding as a double three Elliott Wave structure where Minute wave ((w)) ended at 124.46 and Minute wave ((x)) ended at 123.62. Minute wave ((y)) is in progress and also unfolding as a double three. Near term focus is on 125.42 – 125.68 to complete Minutte wave (w) of ((y)). Afterwards, pair should pullback in Minutte wave (x) of ((y)) in 3, 7, or 11 swing before turning higher again, provided pivot at 123.6 low stays intact. We don’t like selling the pair.
EURJPY 1 Hour Elliott Wave Chart
عضو المتداول العربي
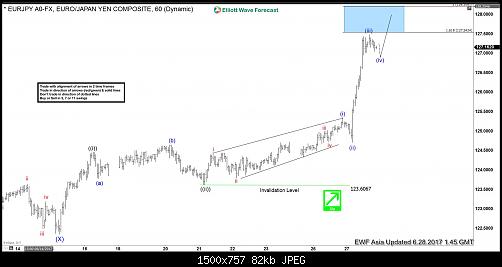
EURJPY Elliott Wave Analysis Update 6.28.2017
Short term EURJPY Elliott Wave view suggests the decline to 122.35 on 6/15 low ended Intermediate wave (X). Rally from there is unfolding as an impulse Elliott Wave structure with extension where Minute wave ((i)) ended at 124.46 and Minute wave ((ii)) ended at 123.62. Minute wave ((iii)) is in progress as 5 waves. After a short term pullback in Minutte wave (iv), another leg higher still can be seen in Minutte wave (v) to finish Minute wave ((iii)). Pair should then pullback in Minute wave ((iv)) before turning higher again. We don’t like selling the pair.
EURJPY 1 Hour Elliott Wave Chart
عضو المتداول العربي
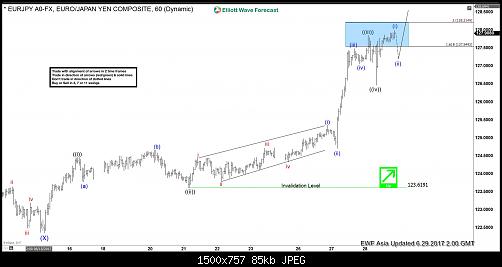
EURJPY Elliott Wave Analysis Update 6.29.2017
Short term EURJPY Elliott Wave view suggests the decline to 122.35 on 6/15 low ended Intermediate wave (X). Rally from there is unfolding as an impulse Elliott Wave structure with extension where Minute wave ((i)) ended at 124.46 and Minute wave ((ii)) ended at 123.62. Minute wave ((iii)) ended at 127.84 and Minute wave ((iv)) at 126.46. Up from there pair has broken above the wave ((iii)) peak suggesting the next leg higher in Minute wave ((v)) has started already and after a short term pullback in Minutte wave (ii) pair should see more upside. We don’t like selling the pair.
EURJPY 1 Hour Elliott Wave Chart
عضو المتداول العربي
USDX Elliott Wave View: Showing impulse
Short term Elliott wave view in USDX suggest that the cycle from 6/20 peak (97.88) is unfolding as an impulsive Elliott wave structure . This 5 wave move could be a wave A of an Elliott wave zigzag structure structure or a wave C of a FLAT correction. In either case, after 5 wave move ends, pair should pull back in 3 waves at least as the Elliott Wave Theory suggests. The Minute wave ((i)) ended at 97.16. Minute wave ((ii)) pullback ended at 97.46, Minute wave ((iii)) at 96.13 low, Minute wave ((iv)) pullback ended at yesterday’s peak 96.61. Below from there Minute wave ((v)) is in progress either in wave C or A, which already reached the minimum extension area in between inverse 1.236-1.618% extension area of previous wave ((iv)) at 96.02-95.83 area and also the 100% to 1.618% extension area of ((v))-((i)) target area at 95.86-95.51 area.
Which means cycle from 6/20 peak (97.88) is mature and pair can start the 3 waves bounce at any moment. However while below 96.61 peak another marginal push lower towards 95.51 area could be seen before ending the cycle. In case of further weakness in Minute wave ((v))) pair could see 0.618-0.764% fibonacci Extension area of wave ((i))+((iii)) at 95.55-95.29 area before ending the 5 waves impulse sequence from 6/20 peak. Afterwards, DXY should bounce in 3, 7 or 11 swings for the correction of 6/20 cycle before more downside is seen provided the pivot at 6/20 peak remains intact or If the bounce turns out to be stronger than expected and breaks the pivot at 6/20 peak (97.88) then that would suggest 5 wave move up from 97.88 low was part of a wave C of a FLAT from 6/14 (96.27) low and pair may resume higher.
USDX 1 Hour Elliott Wave Chart
عضو المتداول العربي
High Frequency Trading and Elliott wave Theory
The development of computer technology and the Internet is perhaps the most important progress that shape and characterize the 21st century. The proliferation of computer-based and algorithmic trading breed a new category of traders who trade purely based on technicals, probabilities, and statistics without the human emotional aspect. In addition, these machines trade ultra fast in seconds or even milliseconds buying and selling based on proprietary algos.
No doubt the trading environment that we face today is completely different than the one in the 1930’s when Elliott first developed his wave principle. Legitimate questions arise whether Elliott Wave Principle can be applied in today’s new trading environment. After all, if it’s considered to be common sense to expect today’s cars to be different than the one in the 1930’s, why should we assume that a trading technique from 1930 can be applied to today’s trading environment?
What is ‘High-Frequency Trading – HFT’
High-frequency trading (HFT) is a program trading platform that uses powerful computers to transact a large number of orders at very fast speeds. It uses complex algorithms to analyze multiple markets and execute orders based on market conditions. Typically, the traders with the fastest execution speeds are more profitable than traders with slower execution speeds. The reason is the decision making process, which as Humans , we do not have the mental speed or power to execute at these higher levels which are almost 100% perfection.
High Frequency Trading (HFT) is controversial and has been met with some harsh criticism. Because of the used of mathematical models and algorithms to make decisions, taking human decision and interaction out of the equation. Decisions happen in milliseconds, and this could result in big market moves without reason and also make the Market less Human.
We have seen through the years an enormous amount of charts, we do an average of 3000 charts per month and we have looked very deep into the relationship between Elliott wave Theory and this new way of trading. We have found out there is a combination and have a lot to do with the Fibos relationship which created the wave patterns, instead of the Old way which most of the time was based in the 5 wave patterns and was associate to the crowd mod or way of thinking, meaning when the crowd is happy, Market goes higher, when the Crowd is pessimist the Market start dropping. It is always hard to change, but reality jump in and we were able to understand these Computers have some sort of triggers which determined when a cycle has ended and then the pattern start. It is a very simple process which starts from the Century charts and ended in mini seconds charts. This Computer is able to related and take decisions without any mistake, which related to Humans is an amazing improve, because of that, we always told members, the Market works perfectly and what we missed as Humans is the triggers which determined in a matter of second not to keep trading aside and switch to the other.
We called this Trigger the Distribution and it is a system in which sequences need to keep in one direction not only in price, but also in momentum, we as Human failed to take these decisions faster and with higher degrees of perfections, but the Machines do get it right most of the time. High Frequency Trading relates the Time frames and cycles and then created a main trend and a series of cycles within the Main trend; they keep either buying or selling the Trend until a cycle end. Many have been making counts in the $SPX Weekly charts and have created as much as possible 5 waves counts, have made ending diagonals within ending diagonals and the Index still keep going higher. The reality is that the High Frequency Trading Machines are buying the Index until the trend fail and in order not to happen a strong move to the downside need to happen to break what we called Pivots, which is another important aspect because they keep cycles within time frames to stay alive. In Reality Elliott wave was created or developments in the Market one way in 1930, but with the High Frequency trading ruling the Market since the Computer revolution these machines have changed the way for the Market to create the Pattern and consequently the way The Elliott wave Theory is seen. We have been working into this idea for years and have been able to find a system which make a mix between the Old Elliott wave Theory and most newly version which come with the High Frequency Trading as the one ruling the Market instead of the crowd sentimental , unless the Computers goes out Trading is hard to see The Elliott wave Theory the way it was, so better adjust to the time and become a better trader and join the one that ruling.
عضو المتداول العربي
CHF JPY Bullish Elliott Wave Sequence
In this article we will take a look at Elliott Wave structure of CHF JPY pair since the low at 4.16.2017. Move up from 4.16.2017 (107.67) to 5.25.2017 (115.16) was in 7 swings and completed wave (W). Then we saw the pair pull back from the highs. Below is the 480 minute chart presented to clients on 11th June 2017 where we were looking for pair to end the correction in 112.87 – 111.52 area and resume the rally for new highs.
CHF JPY 11 June 480 minute chart
CHF JPY 30 June 480 minute chart
Pair found buyers in the blue box between 112.87 – 111.52 and rallied to new highs as expected. With the latest rally from 112.46 – 117.78, pair is showing 5 swings up from 4.16.2017 low which is a bullish sequence and calls for more upside against 112.46 low to complete a double three Elliott wave structure. Pair has reached 0.618 – 0.764 Fibonacci extension area of (W)-(X) between 117.00 – 118.18 which is the typical area for 5th swing to end in a 7 swing sequence. Thus, we are expecting the pair to make a pull back in wave B and continue higher towards 119.95 – 121.72 area. We don’t like selling the pair in proposed wave B pull back and expect dips to find buyers in 3, 7 or 11 swings for continuation higher. If pair drops from here 116.23 – 115.94 would become next area of interest for wave B to complete and buyers to appear to start C leg higher or bounce in 3 waves at least.
عضو المتداول العربي
Next Elliott Wave Target for Bitcoin BTCUSD
Bitcoin is still considered as the currency of the Dark Web, despite the fact that it was the world’s best performing currency in 2015 & 2016 and currently 1 Bitcoin (BTCUSD) is worth 2 Ounces Of Gold which is significantly important in the financial world. The digital currency continued it’s outstanding performance during this year with and it’s up +260% but Ethereum has taking over the show with +3200% rise since January.
We implemented our Elliott Wave technique in our previous articles to predict the rise of Bitcoin and how it was looking to make new all time highs. Then we explained that despite BTCUSD was reaching a Warning Stage, it would remain bullish looking for more gains to come.
Bitcoin managed to reach $3000 on 06/12 which is new milestone for Bitcoin, then it saw a 30% correction which presented another opportunity to buy it again as we mentioned that the currency is a buy into dips using the corrective sequence 3 , 7 or 11 swings to find good entries. So let’s take a look at the current chart and see the potential coming move.
BTCUSD 4H Chart 07/01/2017
BTCUSD cycle from 2015 lows remain in progress and the instrument currently still has the potential to add another leg higher toward $3250 – $3500 at minimum before ending wave III and doing a larger pullback. However we need to keep in mind that the third wave is usually the strongest one and can keep adding more extension to the upside. Consequently, it’s not recommended to sell the instrument and until the pivot at 06/15 low 2120 gives up you should keep trading with the main bullish trend.
To add more conviction to the above view we can use a correlated different type of instrument and until the crypto-currency gets approved for it’s own proper ETF, we can use The Grayscale Bitcoin Investment Trust GBTC (Its shares represent almost 1/10 of a Bitcoin).
GBTC 1H Chart 06/12/2017
GBTC is sharing the same oscillation with Bitcoin with a slightly different cycle because the instrument did a double three structure to correct the whole cycle from 2016 low. It found buyers at extreme area 366-246 and now it could have started a new bullish cycle which can take it toward $870 – $940 area and that will support the Bitcoin move higher.
What would happen if both instruments fails to make new highs ?
In that case there is no need to panic because GBTC will extend it’s correction lower and can be bough later on at the next extreme area around $200 from May peak. If BTCUSD pivot at 2120 low gives up then wave III could be already in place and it will do the double correction from June peak toward $1930 – $1725 area which will be the next area to look for buyers.
Recap
BTCUSD bullish cycle remain in progress with a potential move higher toward $3250 – $3500 area which is also supported by the same oscillation in GBTC provided that June pivot keeps holding.
The crypto-currency market was extremely volatility in the recent months and it presents a lot of risk for short term trader, that’s why you need to have a good system that can help you define your trading areas and use the proper risk management to protect your account. So if you trade or invest in CryptoCurrencies and you are interested in further structures & sequences then you can start by learning the basics of the Elliott Wave theory.
عضو المتداول العربي
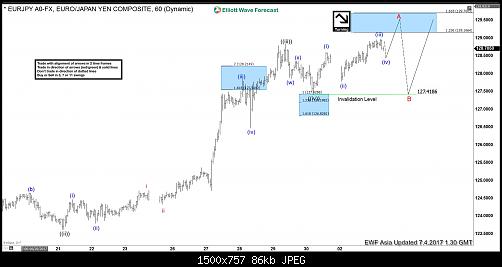
EURJPY Elliott Wave View: Ending Impulse
Short term EURJPY Elliott Wave view suggests the decline to 122.35 on 6/15 low ended Intermediate wave (X). Rally from there is unfolding as an impulse Elliott Wave structure with extension. This 5 wave move could be Minor wave A of an Elliott wave zigzag structure structure, where Minute wave ((i)) ended at 124.46 and Minute wave ((ii)) ended at 123.62. Minute wave ((iii)) ended at 127.84, Minute wave ((iv)) at 126.46 and Minute wave ((v)) of A is in progress towards 129.16 – 129.7.
Near term, while pair stays above 127.41, expect further upside towards the mentioned target. Afterwards, pair should pull back in larger degree 7 or 11 swings to correct cycle from 6/15 low before the rally resumes again. We don’t like selling the Index and expect buyers to appear after 7 or 11 swings pull back for extension higher. This view remains valid as far as pivot at 6/15 low 122.35 remains intact.
EURJPY 1 Hour Elliott Wave Chart 7/4/2017
عضو المتداول العربي
Next Elliott Wave Target for Ethereum ETHUSD
There has been a lot of headlines lately as the world’s new favorite cryptocurrency Ethereum (ETHUSD) soared +5,000% in value before the price dropped and it’s currently still up over 3,500%. Ethereum was only developed two years ago while bitcoin’s been around for almost eight years , many investors are expecting the ether token to take over in the coming months as it’s positioned to surpass bitcoin as the world’s largest cryptocurrency by market cap.
We discussed in our previous article how ETHUSD was leading the way for BTCUSD and we expected another leg higher to take place toward 315 – 365 which was achieved then surpassed as Ethereum managed to break the $400 handle before retracing lower. Let’s take a look at the 4H chart using Elliott Wave Theory to determine the next move.
ETHUSD 4H 07/01/2017
Ethereum did 7 swings sequence to end a double three correction around equal legs $228 – $193, then it started the bounce higher which allowed traders to protect their Long positions. So currently as the as the price stays above $203.9 level then ETHUSD should remain supported and extend to the upside looking for new highs or at least finish 3 waves bounce around $350 – $380.
ETHUSD Daily 07/01/2017
The pullback from 06/12 peak ended up by correcting the entire cycle from the lows, it reached the 50% of the rally around $205 and bounced from there. Consequently, the move higher has the potential to reach equal legs area $615 – $712 and even extend toward $870 it it turns out to be the 3rd wave of an impulsive move.
Recap:
Ethereum is currently the best performing currency for 2017 and it still has the potential for further gains in the second half of the year if the price manage to break above 06/12 peak. The move is expected to happen when Bitcoin starts it’s next leg higher which will drive more power to the rest of the digital market.
عضو المتداول العربي
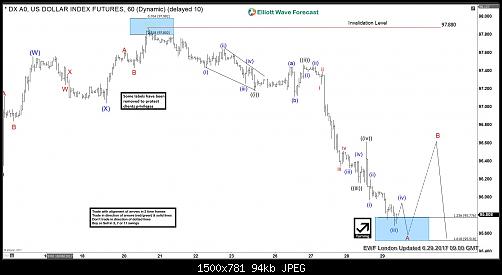
USDX Elliott Wave View: Correction in progress
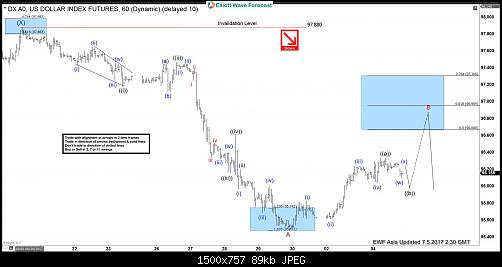
Short term USDX (USD Index) Elliott Wave view suggests the rally to 97.88 high on 6/20 ended Intermediate wave (X). Decline from there is unfolding as an impulse Elliott Wave structure with extension and ended at 95.47 low on 6/29. This 5 wave move could be Minor wave A of an Elliott wave zigzag structure structure, where Minute wave ((i)) ended at 97.17 and Minute wave ((ii)) ended at 97.47. Minute wave ((iii)) ended at 96.15, Minute wave ((iv)) at 96.61 and Minute wave ((v)) of A ended at 95.47.
Minor wave B bounce is currently in progress to correct cycle from 6/20 peak. The subdivision of Minor wave B is unfolding as an Elliott wave zigzag structure. Minute wave ((a)) ended at 96.33 and near term, Minute wave ((b)) pullback is in progress to correct cycle from 6/29 low in 3, 7, or 11 swing before turning higher again. While the pullback stays above pivot at 6/29 low (95.47), USDX has scope to extend higher one more leg towards 96.66 – 96.95 area to end Minor wave ((c)) of B. Afterwards, while bounces stay below pivot at 6/20 high (97.88), expect USDX to resume lower again. We don’t like buying the proposed bounce.
USDX 1 Hour Elliott Wave Chart
عضو المتداول العربي
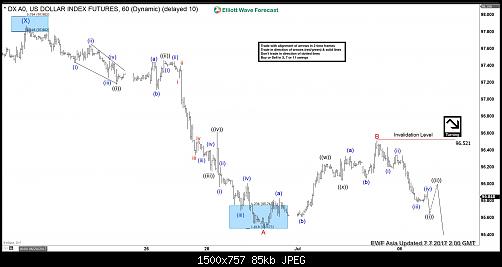
USDX Elliott Wave Analysis 7.6.2017
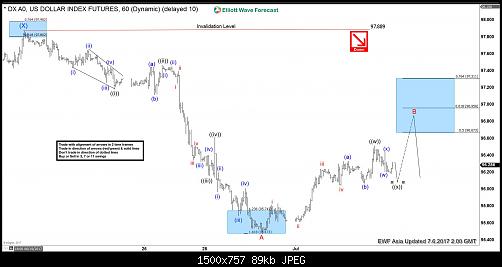
Short term USDX (USD Index) Elliott Wave view suggests the rally to 97.88 high on 6/20 ended Intermediate wave (X). Decline from there is unfolding as an impulse Elliott Wave structure with extension and ended at 95.47 low on 6/29. This 5 wave move could be Minor wave A of an Elliott wave zigzag structure structure, where Minute wave ((i)) ended at 97.17 and Minute wave ((ii)) ended at 97.47. Minute wave ((iii)) ended at 96.15, Minute wave ((iv)) at 96.61 and Minute wave ((v)) of A ended at 95.47.
Minor wave B bounce is currently in progress to correct cycle from 6/20 peak. Revised view suggests the subdivision of Minor wave B is unfolding as an Elliott wave double three structure. Minute wave ((w)) ended at 96.51 and near term, Minute wave ((x)) pullback is in progress to correct cycle from 6/29 low in 3, 7, or 11 swing before turning higher again. While the pullback stays above pivot at 6/29 low (95.47), USDX has scope to extend higher one more leg towards 96.67 – 97.31 area to end Minute wave ((y)) of B. Afterwards, while bounces stay below pivot at 6/20 high (97.88), expect USDX to resume lower again. We don’t like buying the proposed bounce.
USDX 1 Hour Elliott Wave Chart
عضو المتداول العربي
USDCAD Forecast and BOC Meeting Next Week
Bank of Canada will have a meeting on July 12 to decide the interest rate. USDCAD has declined due to recent comments made by top Bank of Canada officials which seem to suggest that interest rates could be raised soon. The market in fact is pricing in an 82 percent chance of a rate hike next week. In a CNBC interview last week, Bank of Canada Governor Stephen Poloz said that the two interest rate cuts by Bank of Canada in 2015 have done their jobs in shielding Canadian economy from the steep fall in the price of oil. He also added that the central bank needs to consider its options as excess capacity in the economy is used up.
Mr. Poloz reiterated his hawkish stance in a recent interview with German newspaper Handelsblatt. He said that monetary policymakers must “anticipate where the economy will be 18 or 24 months from now”. He also said inflation in Canada should be well into an uptrend by the first half of 2018. Thus normalization must begin before the price growth hits its target.
The Canadian dollar strengthened against the U.S dollar on Tuesday after his comments. The loonie touched its strongest intraday level in nine months at 1.2908. The strength in loonie is not only based on rate hike expectation alone. Recent economic data also shows Canada’s economy grew for sixth consecutive month in April. Meanwhile, business sentiment suggest companies feel more optimistic. Prices of oil, one of Canada’s major exports, also started to recover. This further adds support for the Canadian dollar.
Data from CFTC (U.S Commodity Futures Trading Commission) shows a record pace of short covering in the Canadian dollar for a fifth straight week. The June 27 COT (Commitment of Traders) report below shows non commercial’s net short positions in Canadian dollar dropped to 49,495 contracts from 82,881 a week earlier. With the net short position remains elevated at 50K, CAD remains vulnerable to short squeeze and position adjustment.
USDCAD Long Term Analysis
Daily USDCAD chart above shows pair declined sharply after reaching the peak on January 20, 2016. Pair declined from 1.4693 to 1.2461 (approximately 2200 pips) within a span of less than 4 months. The decline finally bottomed on May 3, 2016. The pair then took 1 year time from May 3, 2016 to May 5, 2017 to correct the decline in overlapping fashion, characteristic of a correction. This correction looks to be forming a bearish flag and recently pair has broken below the channel which may suggest that the correction is complete on May 5, 2017. A break below May 3, 2016 low (1.2461) will give the final confirmation that pair has started the next leg lower.
USDCAD 4 hour Elliott Wave Sequence Chart
USDCAD 4 Hour chart above shows a 5 swing bearish sequence from May 4, 2017 high. Please note that this is not the same as 5 waves impulse, but rather the number of swing count. The 5 swing sequence suggests that while the sixth swing bounce fails below swing #4 high at 1.3328, more downside can be seen in the pair.
As the market is dynamic, traders need to keep up with the most up-to-date analysis of their favorite instrument. Successful traders need to have a good trading system and also strict risk management with rules that define entry, stop loss, and take profit levels with high accuracy to allow traders to get into a risk free position in your trade as quickly as possible.
عضو المتداول العربي
USDX Elliott Wave View: Downside Resumes
Short term USDX (USD Index) Elliott Wave view suggests the rally to 97.88 high on 6/20 ended Intermediate wave (X). Decline from there is unfolding as an impulse Elliott Wave structure with extension and ended at 95.47 low on 6/29. This 5 wave move could be Minor wave A of an Elliott wave zigzag structure structure, where Minute wave ((i)) ended at 97.17 and Minute wave ((ii)) ended at 97.47. Minute wave ((iii)) ended at 96.15, Minute wave ((iv)) at 96.61 and Minute wave ((v)) of A ended at 95.47.
Revised view calls for Minor wave B bounce completed at 96.52. For this view, a break below Minor wave A at 95.47 will add more validity. Until then, a double correction in Minor wave B can’t be completely ruled out. The subdivision of Minor wave B is unfolding as an Elliott wave double three structure. Minute wave ((w)) ended at 96.24, Minute wave ((x)) ended at 96.04 and Minute wave ((y)) of B ended at 96.52. Near term, while bounces stay below Minor wave B at 96.52, expect the Index to resume lower. We don’t like buying the Index.
USDX 1 Hour Elliott Wave Chart 07/07/2017