الأكثر زيارة

 رد مع اقتباس


عروض شركات الفوركس
 | |  | |  |  |  |

 عضو المتداول العربي
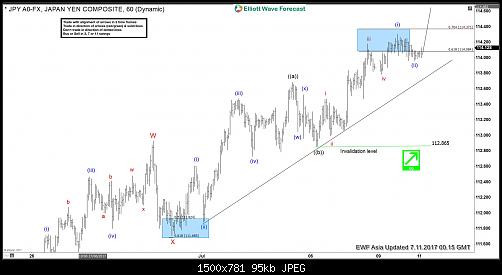
USDJPY Elliott Wave View: Bullish Against 112.86
Short term USDJPY Elliott Wave view suggests the pullback to 111.7 low on 6/29 ended Minor wave X. Up from there, wave Y is unfolding as an Elliott wave zigzag structure where Minute wave ((a)) ended at 113.68 and Minute wave ((b)) ended at 112.86. Up from there, Minutte wave (i) of ((c)) ended at 114.3. Minutte wave (ii) of ((c)) ended at 113.96, but a break above 114.3 will add validity to the view that the next leg higher has started. Until then, a double correction in Minutte wave (ii) still can’t be ruled out before pair resumes the rally higher. Near term, while dips stay above 112.86, and more importantly as far as pivot at 111.7 low stays intact, expect pair to extend higher. We don’t like selling the pair.
USDJPY 1 Hour Elliott Wave Chart
عضو المتداول العربي
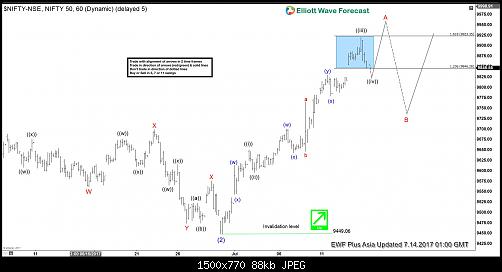
Nifty Elliott wave view 7.14.2017
Short term NIFTY Elliott Wave view suggests the rally to 9709.3 ended Intermediate wave (1), and the pullback to 9449.06 low ended Intermediate wave (2). Rally from there could be unfolding as an Elliott wave Zigzag structure where Minor wave A is in progress as a Leading diagonal structure. Minute wave ((i)) ended as a double three Elliottwave structure at 9649.80 and Minute wave ((ii)) ended at 9596.30. Up from there Minute wave ((iii)) is unfolding as Elliott wave Triple three structure where Minutte wave (w) ended at 9700.7, Minutte wave (x) ended at 9642.65, Minutte wave (y) ended at 9830.05, second Minutte wave (x) ended at 9778.85 low, and Minutte (z) of ((iii)) is proposed complete at 9892.6.
Expect Index to pullback in Minute wave ((iv)) in 3, 7, or 11 swing to correct the cycle from 9595.50 low before the rally resumes higher again for 1 more leg in Minute wave ((v)) of A. Afterwards index should pullback in Minor wave B to correct the cycle from 9449.06 low in 3, 7 or 11 swing before another extension higher. We don’t like selling the Index and expect buyers to appear after Minute wave B pullback is complete provided the pivot at 9449.06 low remains intact.
NIFTY 1 Hour Elliott Wave Chart
عضو المتداول العربي
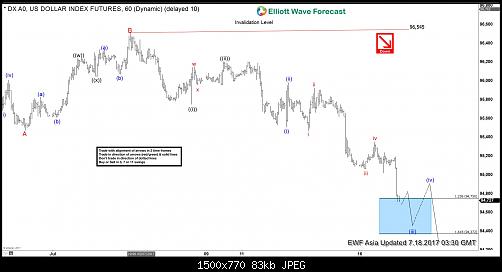
DXY Elliott Wave View: More Downside
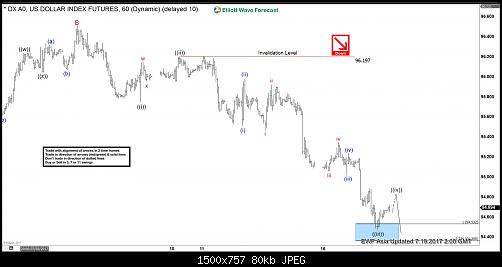
Short term DXY (USD Index) Elliott Wave view suggests the decline from 6/20 peak (97.87) is unfolding as a Zigzag Elliott Wave structure. Down from 97.87 high, decline to 95.47 ended Minor wave A, and bounce to 96.51 high ended Minor wave B. Wave C is unfolding as an Elliott wave Impulse structure with extension where Minute wave ((i)) ended at 95.75 and Minute wave ((ii)) ended at 96.2. Minute wave ((iii)) is subdivided into another impulsive wave of a smaller degree. Minutte wave (i) ended at 95.51, Minutte wave (ii) ended at 95.98 and Minutte wave (iii) is currently in progress. Expect Minutte wave (iii) to end at 94.3 – 94.7 area, then the Index should bounce in Minutte wave (iv) before turning lower again. We don’t like buying the Index and expect bounces to find offer in 3, 7, or 11 swing for more downside.
DXY 1 Hour Elliott Wave Chart
متداول متميز / مشرف سابق
thank you bro
it's really great work
عضو المتداول العربي
موضوع اكثر من رائع شكرا لك
متـــداول بلاتـيـــــني
شكرا للموضوع المهم.
متابعين معك.gif "Eh S(7)")
عضو المتداول العربي
المشاركة الأصلية كتبت بواسطة hema007
 على الرحب والسعة
عضو المتداول العربي
DXY Elliott Wave View 7.19.2017
Short term DXY (USD Index) Elliott Wave view suggests the decline from 6/20 peak (97.87) is unfolding as a Zigzag Elliott Wave structure. Down from 97.87 high, decline to 95.47 ended Minor wave A, and bounce to 96.51 high ended Minor wave B. Wave C is unfolding as an Elliott wave Impulse structure with extension where Minute wave ((i)) ended at 95.75, Minute wave ((ii)) ended at 96.2, and Minute wave ((iii)) ended at 94.47. Minute wave ((iii)) is subdivided into another impulsive wave of a smaller degree. Minutte wave (i) ended at 95.51, Minutte wave (ii) ended at 95.98, Minutte wave (iii) ended at 95.01, Minutte wave (iv) ended at 95.24, and Minutte wave (v) of ((iii)) ended at 94.47.
Currently Minutte wave ((iv)) is in progress to correct cycle from 7/10 high, and while pivot at 7/10 high holds, expect Index to turn lower again. We don’t like buying the Index and expect bounces to find offer in 3, 7, or 11 swing for more downside.
DXY 1 Hour Elliott Wave Chart
عضو المتداول العربي
SPX Elliott wave view: Showing impulse
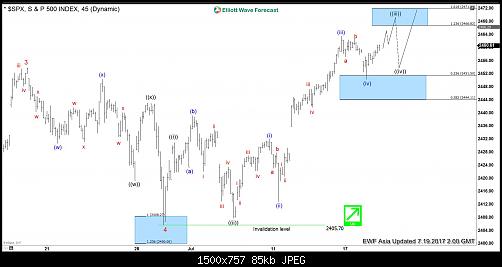
Short term SPX Elliott Wave view suggests the rally from 5/18 low (2352.7) to 6/19 peak (2453.8) ended Minor wave 3. The pullback from 2453.8 to 2405.70 on 6/29 low ended Minor wave 4. Up from there, the rally is unfolding as an impulse Elliott Wave structure with extension. This 5 waves move could be Minute wave ((a)) of an Elliott wave zigzag structure where Minute wave ((i)) ended at 2431 and Minute wave ((ii)) ended at 2407.7.
Minute wave ((iii)) is subdivided into another impulsive waves of a smaller degree. Minutte wave (i) ended at 2432, Minutte wave (ii) ended at 2412.8 and Minutte wave (iii) ended at 2463.5. Below from there Minutte wave (iv) ended at 2450.34 and above from there Minutte wave v of ((iii) is in progress towards 2466.82-2471.8 area. Afterwards, the Index should pullback in Minute wave ((iv)) before further upside, provided that pivot at 2405.70 low remains intact.
In case of further extension in Minutte wave (v) of ((iii)), the index could extend to (v)=(i) target area at 2474.7-2480.4 before a turn in Minute wave ((iv)) happens. If the pullback turns out to be rather strong then the Index could already end the cycle from 6/29 low (2405.7) as an Elliottwave Flat structure, and it should then correct the cycle from 6/29 low before the rally resumes. We don’t like selling the Index and favors more upside as far as pivot at 2405.70 low remains intact.
SPX 1 Hour Elliott Wave Chart
عضو المتداول العربي
DXY Elliott Wave View: Bounce in progress
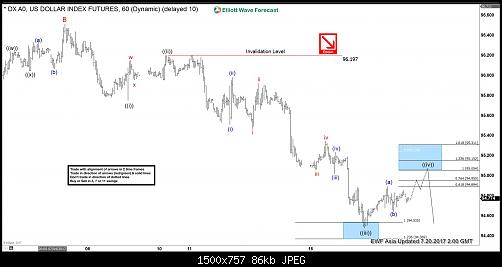
Short term DXY (USD Index) Elliott Wave view suggests the decline from 6/20 peak (97.87) is unfolding as a Zigzag Elliott Wave structure. Down from 97.87 high, decline to 95.47 ended Minor wave A, and bounce to 96.51 high ended Minor wave B. Wave C is unfolding as an Elliott wave Impulse structure with extension where Minute wave ((i)) ended at 95.75, Minute wave ((ii)) ended at 96.2, and Minute wave ((iii)) ended at 94.47. Minute wave ((iii)) is subdivided into another impulsive wave of a smaller degree. Minutte wave (i) ended at 95.51, Minutte wave (ii) ended at 95.98, Minutte wave (iii) ended at 95.01, Minutte wave (iv) ended at 95.24, and Minutte wave (v) of ((iii)) ended at 94.47.
Currently Minutte wave ((iv)) is in progress to correct cycle from 7/10 high as a double three Elliott wave structure towards 95.05 – 95.15. While pivot at 7/10 high holds, expect Index to turn lower again. We don’t like buying the Index and expect bounces to find offer in the above area for more downside or 3 waves pullback at least.
DXY 1 Hour Elliott Wave Chart
عضو المتداول العربي
JPM Elliott Wave Bullish Structure
The Elliott Wave view for JPMorgan Chase (NYSE: JPM) suggests the rally from February 2016 low (52.5) to 03/01/2017 peak (93.98) have ended wave (3). The pullback from there unfolded as zigzag ABC structure which ended wave (4) at 06/01/2017 low (81.79). Up from there, the stock rallied in another zigzag structure before ending that short term cycle after reaching extreme on 07/06/2017 peak (94.51).
Therefore, JPM made new all time highs and it’s now showing 5 waves from 2016 low and still looking to reach the minimum target at $100.5. The stock can either rally from current levels as it already did 3 waves pullback and reached short term equal legs area 90.9 – 89.39, or the correction can still extend further toward the 50 – 76.4 Fibonacci retracement before finding buyers again to rally to new highs or bounce in 3 waves at least.
However if JPM fails to make new highs and the pivot at June low gives up, then the stock could be still in wave (4) doing an Irregular Flat correction which can take it toward 82-97 area before being able to resume the rally.
JPM 4H Chart 07/20/2017
The market conditions have changed over time, so instruments can now be trending higher or lower in series of 3 wave sequences rather than impulsive sequence and this can be frequently seen in the forex market. No one is perfect and we don’t claim to have 100% accuracy, but a system with high accuracy acts as a great trading tool because forecasting is a process of continuous adjustments. A waver (trader) needs to accept when an idea doesn’t work out and adjust to new data.
عضو المتداول العربي
DXY Elliott Wave View: Resuming Downside
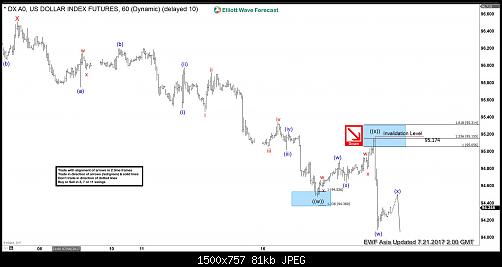
Revised short term DXY (USD Index) Elliott Wave view suggests the decline from 6/20 peak (97.87) is unfolding as a double three Elliott wave structure. Down from 97.87 high, decline to 95.47 ended Minor wave W, and bounce to 96.51 high ended Minor wave X. Wave Y is unfolding as another double three Elliott wave structure of a smaller degree where Minute wave ((w)) ended at 94.47 and Minute wave ((x)) ended at 95.17. The Index has broken below 94.47 suggesting Minute wave ((y)) lower has started. Down from 94.47, Minutte wave (w) ended at 94.09, and Minutte wave (x) is in progress to correct cycle from 7/20 peak before Index resumes lower. We don’t like buying the proposed bounce and expect sellers to appear after Minutte wave (x) bounce is complete in 3, 7, or 11 swing as far as pivot at 95.17 stays intact.
DXY 1 Hour Elliott Wave Chart
عضو المتداول العربي
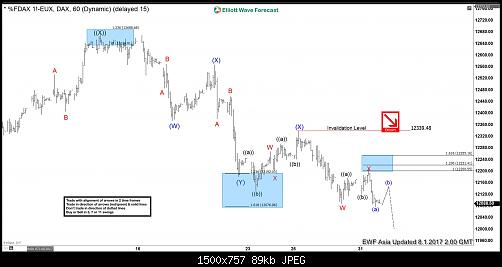
DAX Elliott Wave View: More Downside
Short term DAX Elliott Wave view suggests the decline from 5/15 high is unfolding as a double three Elliott wave structure. Down from 5/15 peak, Primary wave ((W)) ended at 12303 as a Flat and Primary wave ((X)) bounce ended at 12672. Primary wave ((Y)) is currently in progress and unfolding as a triple three Elliott wave structure. Down from 12672 peak, Intermediate wave (W) ended at 12373.5, Intermediate wave (X) ended at 12567, Intermediate wave (Y) ended at 12180.5 and Intermediate second wave (X) ended at 12339.48. Near term, while bounces stay below 12339.48, expect the Index to resume lower towards 11878.65 – 12030.11 area to end cycle from 5/15 high. Afterwards, from that area, expect the Index to at least bounce in 3 waves to correct cycle from 5/15 high.
DAX 1 Hour Elliott Wave Chart
عضو المتداول العربي
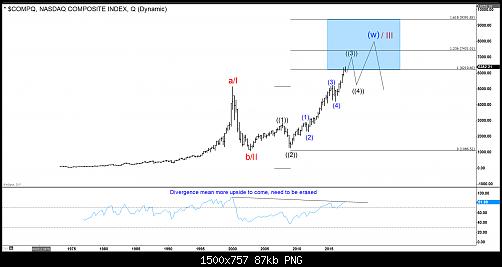
NASDAQ Composite Index should pullback soon
The following chart shows NASDAQ composite index. The index has a tremendous rally since the lows around 1975 which is pretty close to the zero level. The index has reached the bottom of the blue box at 6219 area. The question then is whether the index will extend higher or start correcting lower as the minimal target has been reached. As we often say, Elliott wave theory by itself is not enough. In this case, we can see that from the zero line, we can count the index as a completed ABC. However, we can also count it as an incomplete ABC with a black((4)) still to happen. In the Elliott wave theory, any five waves structure always at one moment is a three wave move. It is therefore too early at this stage to determine if the rally will develop into a five waves move.
In Elliottwave-forecast, we have implemented new ideas and tools to make the theory a more reliable tool. We use cycles, sequences, distributions and momentum indicators to increase the accuracy of Elliott wave theory. As we show in the chart, the RSI (Relative Strength Index) indicator is still showing a divergence compared to the peak in 1999. One of the rules that we introduced in the new Eliott wave theory is that a three waves move can not have divergence in any single time frame. Looking at Nasdaq quarterly chart, we can observe the divergence between momentum and price action. Thus, the index still has scope to extend into the areas of 7431 minimal or even reach the 9391 area before the 2009 rally is complete.
The five waves move in blue degree is now about to end. But we feel very comfortable to say that the pullback will be another buying opportunity. It is very easy to trade following our forecast. We always prioritize the trend and we use a distribution system and a series of pivots and cycles to prioritize the trend. In conclusion, even though the index has reached the minimal target, a multi market correlation and simple indicator like the RSI are calling for a pullback soon into a wave four but more upside to follow afterwards.
Long Term Nasdaq Elliott Wave Path
عضو المتداول العربي
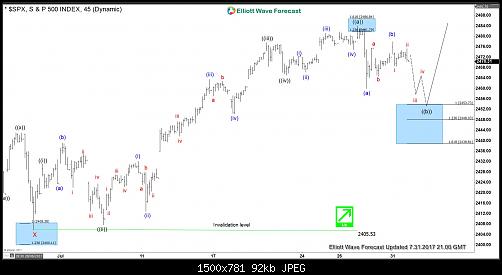
SPX500 Bullish Elliott Wave Sequence
SPX500 move up from 3/27 (2322) low is proposed to be unfolding as a double three Elliott wave structure when rally to 6/19 (2453) completed wave W and dip to 6/29 (2405.74) completed wave X. Up from there, Index rallied in 5 waves to 7/27 (2484) which completed wave ((a)) of Y and now the Index is showing 5 swings up from 3/27 low. 5 swings is an incomplete sequence and calls for more upside to complete 7 swings sequence. Index is currently in wave ((b)) correcting the cycle from 2405.74 low. This pull back is expected to unfold as a zig-zag Elliott wave pattern and while below 7/31 (2477), SPX500 has scope to trade lower towards 2453.73 – 2438.81 area to complete wave ((b)). From this area, SPX500 should turn higher to resume the rally in wave ((c)) of Y towards 2537 – 2568 area or bounce in three waves at least. In case the bounce from the above mentioned area fails to make a new high, then Index could turn lower and do a 7 swings pull back in wave ((b)) before starting wave ((c)) higher. We don’t like selling the Index and favor buying the dip towards 2453.73 – 2438.81 area looking for a target of 2537 area or a 3 waves bounce at least to get into a risk free position.
SPX500 4 Hour Elliott Wave Chart
SPX500 Potential buying area