الأكثر زيارة

 رد مع اقتباس


عروض شركات الفوركس
 | |  | |  |  |  |

 عضو المتداول العربي
General Electric $GE Bounce is from Technicals or Jeff Immelt’s Resignation?
Firstly, I suspect the bounce is technical or at a minimum immaculate timing of the news to go with the technical view. This large multinational organization & conglomerate’s CEO of the past few years Jeff Immeltjust announced he would resign from General Electric and there is an apparent bounce in price on the day of the announcement. This company that really needs no introduction is one of the largest companies in the world and has been around 125 plus years now and is one of the $DJIA Dow Industrial Average’s thirty components as well as one of the $SPX Standard and Poor’s 500 components and is into many different markets where they sell their broad based goods and services. Without further comment on the fundamental and financials of the organization I will stick with the idea the company will find the way to remain profitable and achieve further growth although that becomes harder as time goes on in a larger company’s life cycle.
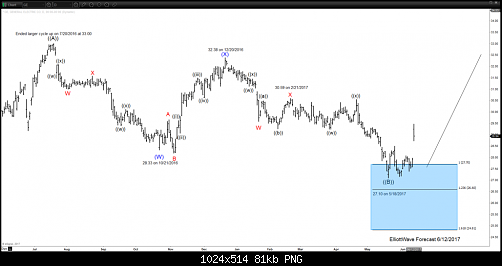
Secondly, the daily chart’s technical picture of the stock from an Elliott Wave perspective is shown below under the end of this article however not shown here in the aforementioned graphic the stock has been in an uptrend since inception with an all time high at 60.50 in the week of 8/28/2000 then for several years suffered the 3 swings lower pullback into the week of 3/2/2009 to a price low at 5.73. From there the stock has lagged it’s underlying indices $SPX and $INDU and has not matched the cycle highs when it bounced and has been the worst performing stock of the $INDU as of late. This is usually an obvious technical red flag when a stock does not run the same cycle with the underlying index it is a component of.
Thirdly, and to conclude. From 3/2/2009 the stock price shows 5 swings up into the 33.00 price registered on 7/20/16 that I’m suggesting & as shown below is a larger degree diagonal ((A)) or even a ((1)) possibly. The dip was a larger 3 swings and appears to have been correcting the cycle up from 2009. As mentioned earlier “I suspect the bounce is technical or at a minimum immaculate timing of the news to go with the technical view”. As you can notice the bounce began about three weeks before the resignation of Jeff Immelt. Price did swing lower into the extension area we will normally expect a bounce from. The sequence and move lower from the 7/20/2016 highs appears to have ended that cycle lower per our usual trend following system here thus when dips are seen, we will look for them to remain above the 27.10 lows for a sustained move higher.
عضو المتداول العربي
URCAD : Sell the Bounce Bearish Pattern
Today’s price action confirms that a possible top has been formed at the June 2/2017 high and EURCAD can be on the way lower to close a market gap that formed on April 23/2017. The turn lower will now give bears a chance to push the pair lower. Below we will show a possible scenario/bearish pattern where bears can enter the market and catch the move lower.
EURCAD 4 hour Possible Bearish Pattern: Traders need to wait for EURCAD to enter between the AB 1.618% – AB 2.24% Fib. levels where blue point C can possibly terminate and react with a bounce higher. If and when blue point C terminates in the suggested area traders will then wait for price to retrace/bounce higher back to the BC 0.50% Fib. retracement level where blue point D can terminate and trigger SELLS. If blue point C terminates in the suggested area and bounces higher to trigger SELLS stops should then be placed at the blue point B high.
If looking to sell EURCAD we prefer waiting for a retracement/bounce to trigger the blue point D sell at the BC 0.50%. Stops should be placed at 1.5255 (point blue B high) and should be sold at the BC 0.50% Fib. level minimum for a better risk/reward trade with targets below the April 23/2017 market gap.
Of course, like any strategy/technique, there will be times when the strategy/technique fails so proper money/risk management should always be used on every trade.
*** Always use proper risk/money management according to your account size ***
عضو المتداول العربي
Preparing for Quantitative Tightening
The Fed will soon embark in an uncharted water of Quantitative Tightening (QT). In the aftermath of 2008 global credit crisis, the world central banks went into the biggest experiment in monetary policy called Quantitative Easing (QE). Central banks printed money and bought the government bonds as the primary way for monetary expansion. The combined balance sheets of the three world central banks below exploded in size to about $13 trillion:
In the U.S., the Fed went into large-scale purchases from 2008 – 2013. They tapered the purchases gradually to zero by 2014. As a consequence, the Fed now holds US $1.8 trillion of mortgage-backed securities (MBS) and US $2.5 trillion of US Treasury Bonds. The Fed has been reluctant to reduce the balance sheet, fearing that mortgage rates and other long term borrowing cost can spike and hurt fragile US economy.
However, at its meeting last March 14-15, the Fed’s Monetary Policy Committee (FOMC) agreed it should start normalizing its $4.5 trillion balance sheet later this year. Another name for this “balance sheet normalization” is “Quantitative Tightening”. The Fed’s current practice is to buy new bonds when the old bonds mature. When the Fed starts the normalization, it will taper the reinvestment of principal. In other words, it will let the old bonds mature and not reinvest to buy new ones. This way the balance sheet shrinks as the Fed receives cash from maturing bonds and not reinvest it. The Fed can also decide to reduce the size of the balance sheet more rapidly by selling its securities holding. However, the passive and predictable option of not reinvesting is more likely.
The chart below projects Fed balance sheet if the Fed stops reinvesting principal from January 2018. By doing so, Fed’s balance sheet should be halved by the end of 2022.
The Fed wants to get back to normal monetary policy by raising short term interest rate and shrinking the balance sheet. Interest rate is expected to go back to 2.5% by late 2018 (currently at 1%) while balance sheet is expected to shrink to $2 trillion by 2022. At Fed’s meeting on Wednesday this week, the Fed could announce the blueprint on how to do it.
Effect of Quantitative Tightening
The big question for investors is whether Quantitative Tightening will tighten monetary condition. The Fed has said that QT should not pose a problem to the economy and can be done gradually without disrupting the market. Philadelphia Fed President Patrick Harker even called the policy of shrinking the balance sheet as “watching paint dry.”
However, if QE resulted in higher inflation expectation, higher long bond yields, and encourage the holdings of risky assets, then in QT regime, we should expect the opposite. As central bank asset purchases diminish over the coming years, there is potential of material price declines in some assets. Both the stock and bond markets have come to depend on the Fed’s programs. S&P 500 has surged more than 250% from the 2008 low while interest rates remain low by historical standard.
In 2013, when Ben Bernanke accidentally hinted on QE tapering, stocks fell, interest rates rose and emerging stock and bond markets crashed, an event known as “taper tantrum”, as market worries about the implication of a less accommodative Fed. Thus, the reversal of the program, if not done the right way, can have major consequences.
10 Year Treasury Note (ZN) Monthly Outlook
The 10 Year T-Note Monthly chart above shows a possible extension to the downside. It still needs to break below 9.6.2013 low (122.07) to confirm the next leg lower is possible. Near term, 10 Year T-Note may correct cycle from 7.6.2016 high first before turning lower. When the Fed stops reinvesting the principal into new bonds, the principle of supply and demand suggests there will be more supply of Treasury debt in the market that needs to find new buyers, thus it’s possible that the bond price falls and yields rise when the Fed starts normalizing the balance sheet.
The Fed’s Quantitative Tightening might have significant implication to all asset classes, including stock, bonds, and US Dollar.
عضو المتداول العربي
GBPJPY Elliott Wave Analysis: Bearish Below 143.9
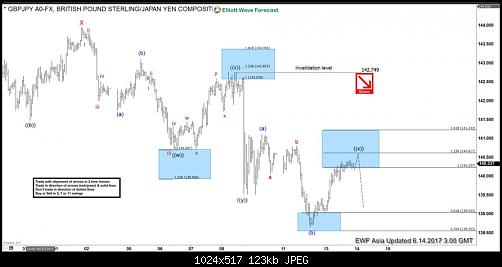
Short term GBPJPY Elliott Wave view suggests the decline from 5/10 high shows a 5 swing sequence, thus favoring more downside. Decline from 5/10 high is unfolding as a double three Elliott Wave structure. Down from 5/10 peak (148.11), Minor wave W ended at 141.47 and Minor wave X ended at 143.96. Minor wave Y is currently in progress and has scope to retest 4/16 low (135.58). Support can be seen at 135.7 – 137.3 area for at least 3 waves bounce.
Subdivision of Minor wave Y is proposed to be unfolding as a triple three Elliott Wave structure. Down from 6/1 peak (143.96), Minute wave ((w)) ended at 140.68, Minute wave ((x)) ended at 142.77, Minute wave ((y)) ended at 139.52 and Minute second wave ((x)) is in progress as a flat and expected to complete at 140.2 – 14.1.2 area. While near term bounce stays below 142.75, and more importantly below 143.95, expect pair to extend lower. We don’t like buying the pair.
GBPJPY 1 Hour Elliott Wave Chart 06/14/2017
عضو المتداول العربي
GBPJPY Elliott Wave Analysis: Resuming Lower
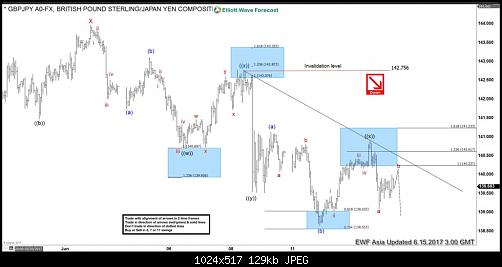
Short term GBPJPY Elliott Wave view suggests the decline from 5/10 high shows a 5 swing sequence, thus favoring more downside. Decline from 5/10 high is unfolding as a double three Elliott Wave structure. Down from 5/10 peak (148.11), Minor wave W ended at 141.47 and Minor wave X ended at 143.96. Minor wave Y is currently in progress and has scope to retest 4/16 low (135.58). Support can be seen at 135.7 – 137.3 area for at least 3 waves bounce.
Subdivision of Minor wave Y is proposed to be unfolding as a triple three Elliott Wave structure. Down from 6/1 peak (143.96), Minute wave ((w)) ended at 140.68, Minute wave ((x)) ended at 142.77, Minute wave ((y)) ended at 139.52 and Minute second wave ((x)) is proposed complete at 140.9. While near term bounce stays below 142.75, and more importantly below 143.95, expect pair to extend lower. We don’t like buying the pair.
GBPJPY 1 Hour Elliott Wave Chart 06/15/2017
عضو المتداول العربي
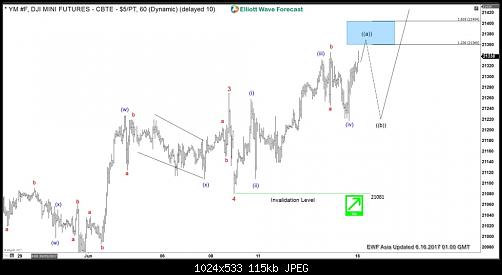
YM (Dow Futures) Elliott Wave Analysis 6.16.2017
Short term YM (Dow Futures) Elliott Wave view suggests the rally from 4/19 low is unfolding as a diagonal Elliott Wave structure where Minor wave 1 ended at 21010 (4/26), Minor wave 2 ended at 20474 (5/18), Minor wave 3 ended at 21270 (6/8), and Minor wave 4 ended at 21081 (6/8). Minor wave 5 is in progress and subdivided into a zigzag Elliott Wave structure. Up from 6/8 low, Minute wave ((a)) is expected to complete at 21360 – 21404. Index should then pullback in Minute wave ((b)) to correct cycle from 6/8 low before the rally resumes. We don’t like selling the proposed pullback. Buyers should appear once Minute wave ((b)) pullback is over in 3, 7, or 11 swing.
YM (Dow Futures) 1 Hour Elliott Wave Chart 06/16/2017
عضو المتداول العربي
Bullish Palladium Supporting Commodities
The world is hooked on ‘Palladium’ because of its uses as an industrial metal and catalyst, the consumers are mainly automobile producers as it’s widely used in gasoline-based engine cars to curb harmful emissions from vehicles. Palladium surged +34% this year on expectations that supply will lag demand for a sixth straight year, beating the rest of commodities, combined with last year gains it results in an impressive 95% rally.
The spot markets are trading above the futures market as it appears that there is a serious shortage of readily available physical bars for spot settlement, which helped the metal to make new 16-year high level of $910 on Friday, June 9. The futures for July expiration touched the peak of $891 the same day.
The recent break higher opened a new extension to the upside as palladium is now showing incomplete bullish 5 swing sequence from 2003 low, which is different from the usual Elliott Wave count as this sequence is part of the double three structure which suggest that a connector is in place between 2011 & 2016 as a flat correction and the 6th swing pullback should hold 2016 low for palladium to be able to resume it’s rally toward the next target around $1170 – $1340. The surprise move would happen if it’s doing a diagonal and currently is in the last 5th wave or the recent new high rally from 2016 lows is part of a flat from 2011 peak, so both these scenarios would result in a significant decline but until there is a sign of 2016 pivot breaking then the metal should remain supported and leading the commodities to the upside.
Palladium Monthly Chart
To compare Palladium to commodities, we added The WisdomTree Continuous Commodity Index Fund (GCC) and The Thomson Reuters/Jefferies CRB Index (TRJEFFCRB) as both are tracking multiple commodities and reflecting the overall trend which has been to the downside since 2011 peak. GCC index has already reached extreme area from 2008 & 2011 peaks suggesting that the bearish cycle is in the last stage even there could be still another leg lower in CRB & GCC which may or may not break the 2016 low. In fact that won’t make any big difference for Palladium as it already created enough separation from 2016 low, so it will be either doing a small correction against May 2017 low or a deeper pullback to correct 2016 cycle before rallying again.
GCC vs CRB vs Palladium
The next graph represents the performance of the platinum-palladium & gold-palladium ratio, a measurement of the number of palladium ounces it takes to buy a single ounce of platinum & gold. Palladium is now almost as expensive as its brother metal platinum for the first time since 2001 as the ratio is near parity and ready to break lower in the near future. The gold-palladium ratio is also catching the move lower and could reach parity if the strong rally in Palladium continues.
Platinum & Gold / Palladium Ratio
Recap
The fundamentals of the palladium market seems to be among the strongest in all the commodities and the recent technical break higher is bringing more bulls to join the rally, so while the metal holds above last year low then it should rise again to make new all time highs above $1100, surpass Platinum and try to catch Gold. The expected move to the upside will support the whole commodity markets so during the short term pullback of palladium, other instrument will either establish new lows or retest the previous one before the entire sector starts rallying again.
عضو المتداول العربي
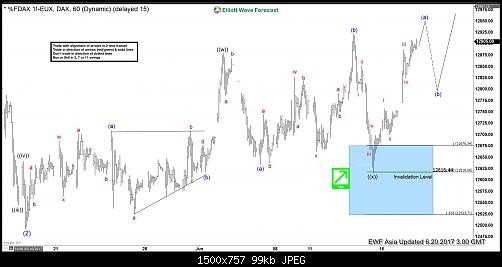
DAX Elliott Wave Analysis: More Upside
Short term DAX Elliott Wave view suggests the decline to 12491.5 on 5/18 ended Intermediate wave (2). Up from there, the rally is unfolding as a double three Elliott Wave structure. Minute wave ((w)) ended at 12879.5 and Minute wave ((x)) pullback ended at 12616.44. Internal of Minute wave ((x)) is subdivided as an expanded flat Elliott Wave structure where Minutte wave (a) ended at 12633.5 and Minutte wave (b) ended at 12922.5.
A break above Minutte wave ((b)) on 6/14 is necessary to add validity that the next leg higher has started. Up from 12616.44, the rally is unfolding as a zigzag Elliott Wave structure where Minute wave (a) is in progress as 5 waves. Expect a pullback in Minute wave (b) soon to correct cycle from 6/15 low (12616.44). While dips stay above 12616.44, expect Index to extend higher. We do not like selling the proposed pullback and buyers should appear once Minute wave (b) pullback is complete in 3, 7, or 11 swing.
DAX 1 Hour Elliott Wave Chart 06/20/2017
عضو المتداول العربي
Gold-to-Silver Ratio Near Turning
Gold-to-Silver Ratio Daily Chart
Gold-to-Silver ratio is correcting cycle from 2/29/2016 peak (83.68) in 7 swing. While the bounces fail below 83.68 high, the ratio should resume lower or at least pullback in 3 waves. Down from 2/29/2016 peak, Intermediate wave (W) ended at 64.38. Intermediate wave (X) is in progress to correct cycle from 2/29/2016 towards 76.58 – 78.7 area before the Ratio turns lower. Short term, while the Ratio stays above 72.46, it should continue higher towards the target above before 3 waves pullback at least.
With the Ratio hovering near the high end of the range, the next leg in the instrument is likely lower after the bounce ends. The Ratio is inversely correlated with the underlying physical metals. This means when the Ratio hits the target and turns lower, Gold and Silver should be supported. Thus, as the Ratio reaches the target of 76.55 – 78.68 and turns lower, both metals can start rallying also.
عضو المتداول العربي
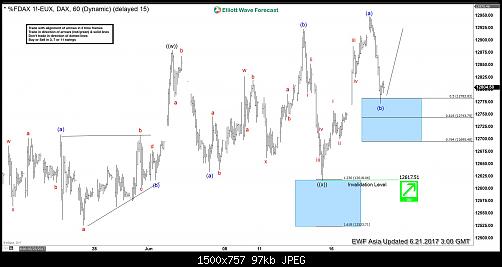
DAX Elliott Wave Analysis: Bullish Against 12617
Short term DAX Elliott Wave view suggests the rally from 5/18 is unfolding as a double three Elliott Wave structure. Minute wave ((w)) ended at 12879.5 and Minute wave ((x)) pullback ended at 12617. Internal of Minute wave ((x)) subdivided as an expanded flat Elliott Wave structure where Minutte wave (a) ended at 12633.5, Minutte wave (b) ended at 12922.5 and Minutte wave (c) of ((x)) ended at 12617. DAX has broken above Minutte wave (b) on 6/14, adding conviction that the next leg higher has started. Up from 12617, the rally is unfolding as a zigzag Elliott Wave structure where Minutte wave (a) ended at 12948.5 and Minutte wave (b) is proposed complete at 12772.5. Near term, while pullbacks stay above 12772.5, and more importantly above 12617, expect Index to extend higher. We do not like selling the proposed pullback.
DAX 1 Hour Elliott Wave Chart 06/21/2017
عضو المتداول العربي
Real Estate (DJUSRE): Buy now or Wait?
We track a lot of Indices around the World. One of the Indices we track is DJUSRE (Dow Jones US Real Estate Index) which provides a guideline for housing properties in the U.S. Buying real estate is always a good way to invest and make money. For years, investors use the real estate sector as one avenue of investment. There is an aspect which many people miss which is the timing. During the 2002-2006 period, prices of properties skyrocketed around the world and many people were able to make a quick profit and cash thousands of dollars out of the investment.
However, there were also many people who got trapped at the top and defaulted on the home loan because of the rapid decline in value and the obligation to the bank. When it comes to real estate, timing is everything and the method of buying also plays a role. There are two ways to buy properties, either using cash or bank’s mortgage. The difference between the two is the interest on the loan, either with a higher monthly payment or with an early penalty that can cost thousands of dollars.
The worst case scenario for an investor is buying at the peak using bank’s loan. During the 2008 – 2009 credit crisis, a lot of home owners owe the bank more than the value of their homes as prices collapse driven by speculative buildup of houses and subprime mortgage. If we drove around in 2010, we were able to see a lot of empty houses and buildings. Most of the buildings belong either to banks or associations.
DJUSRE (Dow Jones US Real Estate) Long Term Chart
Looking at DJUSRE chart above, current real estate price is around the price in 2004-2005. When buying real estate you can do it for a flip or a long term investment. For a flip means that the investor will bet in a fast increase in value and then sell the property for a quick cash. Timing will play a big role when buying for a quick gain as it needs to be done at the proper time. Improper timing can leave investors with a bad investment or like many like to call under the water.
Listening and looking around we can see an increase in TV advertisement on real estate promoting real estate company and sites. These are warning that the crowd has started again to buy properties. Even when the housing boom can last for another couple of years, we can be entering soon into areas when a biggest correction can happen. The increase in advertisement as well as the signs on the streets which is a reflection of the crowd environment is calling for the top to be forming soon.
When looking at DJUSRE Index chart above, if it manages to break above 2007 peak, it’s possible to reach 454 level. This level is when the rally since all-time lows to 2007 will equal to the rally from 2009. When looking at other indices around the world, we believe this could be the scenario in real estate market. When DJUSRE Index breaks above 2007 level, it will drive properties even to new all-time highs, but investors need to know that if they want to buy home now, it is for a quick gain (flip) and not for long Investment.
We need to understand the differences between the two and invest accordingly, otherwise we can get caught in the wrong side. The real estate correction which should happen around the year of 2020 should be bigger than the correction in 2008 and consequently the damage can be even worse. We recommend investors who want long term investment to wait. Regular buyers need to understand that property will revisit these 2009-2010 levels again sometimes in the future so do get any cash out of the property so not to be under the water.
The path we expect for Dow Jones US Real Estate Index is a path to 367 then a turn lower to 320 before last push higher to 454. The Index should then see a huge correction and prices could drop to the levels of 2010 again around 160 when huge buying chances will happen. In reality, Market has two sides and many people who bought in 2009-2010 lows as investment will be selling soon and the market will switch from buyers’ market to sellers’ market again and follow the cycles of the Market.
Understanding the timing is key to enter the real estate market. Current situation is similar to the year of 2004 and the market has 3 or more years to rally when flippers will be able to cash some money. The closer we get to 454 or the year 2020, the danger will increase. Buy now if you a Flipper and wait if you are a long term investor, because there will be a better chance down the road.
عضو المتداول العربي
NZDUSD : Wait for Pullback then Buy Again
NZDUSD is showing 2 bullish patterns on the daily chart so we are expecting for the pair to continue higher. A move lower will now give bulls a chance to push the pair higher. Below we will show the possible bullish scenarios where bulls can enter the market and catch the move higher.
NZDUSD Daily Chart 2 Possible Bullish Patterns: Traders need to wait for NZDUSD to terminate red point C between the red AB 1.618% – AB 2.24% Fib. levels. A move lower from the suggested area to the red BC 0.50% Fib. retracement level will trigger BUYS. As long as price stays above the red point B low, watch for NZDUSD to make another swing higher. There is also strong support/resistance at the red BC 0.50% area which will allow a possible bounce higher. Watch for move higher towards the blue AB 2.24% Fib. level.
If looking to buy NZDUSD we prefer waiting for a retracement/pullback to trigger the red point D sell at the BC 0.50%. Stops should be placed at 0.6816 (point red B low) and should be bought at the BC 0.50% Fib. level minimum for a better risk/reward trade with targets above the blue AB 2.24% Fib. level.
Of course, like any strategy/technique, there will be times when the strategy/technique fails so proper money/risk management should always be used on every trade.
عضو المتداول العربي
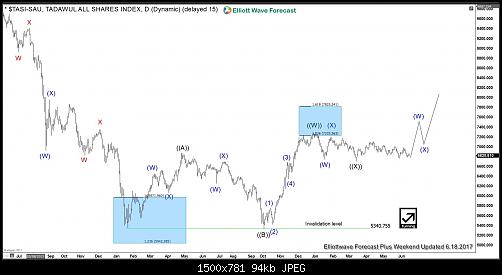
TASI TADAWUL breaks above Jan 2017 after prolong sideways consolidation. Currently up +7% from our weekend updated.
عضو المتداول العربي
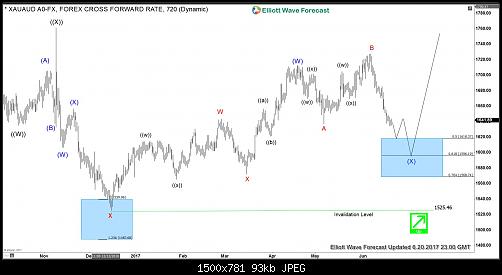
XAUAUD Mid-term Elliott Wave Analysis
Back in November 2016, we mentioned that Gold should find buyers in 1540 – 1487 area and bounce ideally to resume the rally for new highs or in 3 waves at least. 3 weeks later, XAUAUD reached the mentioned area, it then found a low at 1525 on 12/15/2016 and started rallying. Yellow metal has reached 61.8 Fibonacci retracement (1728) of the drop from June 2016 peak and longs from 1540 should be risk free already. Today, we will take a look at the price action from 12/15/2016 low and the current forecast.
XAUAUD Weekly Elliott Wave View
Bigger picture in Gold-AUD remains unchanged. It’s showing 5 swings up from 2008 low which means the sequence is incomplete and calls for extension higher towards 2220 – 2441 area. Pull back in wave “x” reached 50% of wave “w” and is proposed completed at 1525. As dips hold above this level, rally is expected to continue towards 2220 – 2241 area. If pivot at 1525 low gives up during the current pull back, wave “x” could turn into a double three correction towards 1417 area but it should still remain bullish against 1280.52 low. This alternate view is less likely and should only be considered if the pivot or the low at 1525 breaks.
XAUAUD Elliott Wave Diagonal in wave (A)
Yellow metal has ended the cycle from 12/15/2016 (1525) low at 1727.59. Move up from 1525 low could be viewed as an Elliott Wave Diagonal structure i.e wave (A). A pull back in wave (B) should unfold in 3, 7 or 11 swings and hold above 1525 low for extension higher. 1626 – 1602 is 50 – 61.8 Fibonacci retracement area of wave (A) and could complete all of wave (B) or ideally complete just wave W of (B) which would be followed by a bounce in wave X and another push lower to complete wave (B). GCC (Wisdom Tree Commodity Index Fund) Elliott wave structure and sequences supports the idea of a double three correction in wave (B). We don’t like selling the yellow metal and expect dips to remain supported in 3, 7 or 11 swings as far as pivot at 1525 low remains intact.
XAUAUD FLAT in wave (X)
If the cycle from 6/6/2017 (1727.59) extends then, we could consider cycle from 12/15/2016 low to be over at 4/18/2017 (1712.75) i.e. wave (W) followed by a FLAT in wave (X) which should still end between 1618 – 1568 area and then we can see the yellow metal resuming the rally or making a larger 3 waves bounce at least.
عضو المتداول العربي
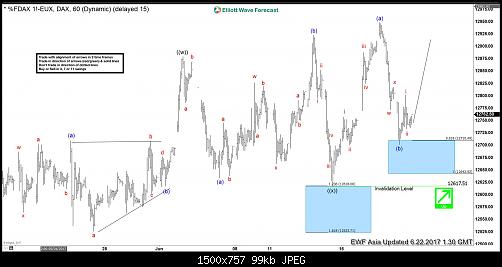
DAX Elliott Wave Analysis: Pullback Completed
Short term DAX Elliott Wave view suggests the rally from 5/18 is unfolding as a double three Elliott Wave structure. Minute wave ((w)) ended at 12879.5 and Minute wave ((x)) pullback ended at 12617. Internal of Minute wave ((x)) subdivided as an expanded flat Elliott Wave structure where Minutte wave (a) ended at 12633.5, Minutte wave (b) ended at 12922.5 and Minutte wave (c) of ((x)) ended at 12617. DAX has broken above Minutte wave (b) on 6/14, adding conviction that the next leg higher has started. Up from 12617, the rally is unfolding as a zigzag Elliott Wave structure where Minutte wave (a) ended at 12948.5 and Minutte wave (b) is proposed complete at 12701.5. Near term, while pullbacks stay above 12701.5, and more importantly above 12617, expect Index to extend higher. We do not like selling the Index.
DAX 1 Hour Elliott Wave Chart