الأكثر زيارة

 رد مع اقتباس


عروض شركات الفوركس
 | |  | |  |  |  |

 عضو المتداول العربي
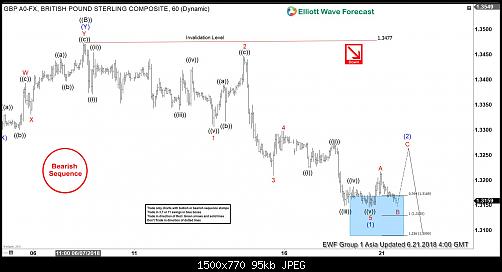
Elliott Wave Analysis: GBPUSD Showing Incomplete Sequence
GBPUSD short-term Elliott Wave view suggests that the recovery to 1.3473 on 6/07/2018 peak ended primary wave ((B)) bounce as double three structure. Below from there, the pair has managed to break below the previous low on 5/29 (1.3203) to confirm the next extension lower in primary wave ((C)) has started. With this break lower, the sequence from 4/17/2018 peak has become incomplete to the downside.
Down from 1.3473 high, intermediate wave (1) unfolded as an impulse structure with lesser degree sub-division showing 5 waves structure in Minor wave 1, 3 & 5. The internals of Minor wave 1 ended in 5 waves at 1.3306. The Minor wave 2 bounce ended at 1.3447. Then Minor wave 3 ended in another 5 waves at 1.3209. Minor wave 4 ended at 1.3298 & Minor wave 5 of (1) is proposed complete in 5 waves at 1.3146 low.
Above from there, pair could have started intermediate wave (2) recovery in 3, 7 or 11 swings. However, pair needs to make further separation from the lows to validate this view. If pair breaks below 1.3146 low instead, then it is still in the process of ending Minor wave 5 lower. Near-term, while pullbacks stay above from 1.3146 low, the pair is expected to do a bounce higher in intermediate wave (2). The it should find sellers in 3, 7 or 11 swings for further downside extension in the pair. We don’t like buying the pair in the proposed bounce. And expect sellers to appear in any rally in 3, 7, 11 swing for extension lower in the pair.
GBPUSD 1 Hour Elliott Wave Chart
عضو المتداول العربي
Palladium (PA_F) Buying Opportunity Ahead?
Palladium ended a cycle from January 2016 low (452.63) and the pull back should be a Palladium Buying Opportunity. Rally from January 2016 low can be counted as an Elliott Wave Impulse when rally to 776 completed wave ((1)), dip to 652.15 low completed wave ((2)), rally to 1023.95)completed wave ((3)), dip to 973.60 low complete wave ((4)) and rally to 1133 completed wave ((5)) which we have labelled as wave “a” of (III) of a diagonal higher.
Palladium Buying Opportunity – Weekly Elliott Wave Analysis
Chart above shows the Impulse rally up from 452.63 low which has completed and we are now in a pull back to correct the cycle from 452.63 low. So far we have seen 3 swings lower to 890.85 which was followed by a bounce which has so far failed below 1133 peak. As bounces fail below 1047.75 ((X)) high and more importantly below 1133 peak, Palladium has scope to trade lower into 806.98 – 749.94 area to complete a 7 swings corrective decline. Due to 5 waves rally from 452.63 low, we expect to see buyers appearing in 806.98 – 749.94 area and then the rally can resume for new highs above 1133 peak or we should get a larger 3 waves bounce at least. Once ((W)) low at 890.85 is broken, we will have 5 swings incomplete sequence down from 1133 peak and then wave (X) bounce could offer a selling opportunity for a move lower into 806.98 – 749.94 area which is where we believe we should get another Palladium buying opportunity.
عضو المتداول العربي
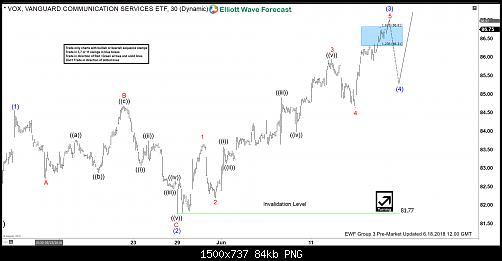
VOX Elliott Wave View: Extending Higher As Impulse
Vanguard communication services ticker symbol: VOX short-term Elliott Wave view suggests that the rally to 84.50 on 5/11 peak ended intermediate wave (1) as an impulse. Down from there, the pullback to 81.78 on 5/29 low ended intermediate wave (2) pullback as expanded Flat. The internals of a Flat correction ended Minor wave A at 82.76, Minor wave B ended at 84.67 high and Minor wave C of (2) ended at 81.78 low.
Up from there, the rally is extending higher in an impulse sequence with extension with lesser degree sub-division showing 5 waves structure in Minor wave 1, 3 & 5. Those 5 waves are expected to complete either intermediate wave (3) or can end some sort of wave (C) of a Flat correction from 5/09 low. The internal of Minor wave 1 ended in 5 waves at 83.62 high, Minor wave 2 ended at 82.19 low. Then the rally to 85.92 high completed another 5 waves in Minor wave 3 higher. The pullback to 84.63 low ended Minor wave 4.
Above from there Minor wave 5 of (3) remains in progress in another 5 waves structure & expected to complete soon as it already reached the minimum extension area already. But in case of further extension higher, the ETF can see 87.19-87.80 0.618-0.764% Fibonacci extension area of 1+3 to complete intermediate wave (3). Afterwards, the ETF is expected to do a pullback in wave (4) for the correction of 81.78 cycle in 3, 7 or 11 swings before further upside is seen. We don’t like selling it into a proposed pullback.
VOX 1 Hour Elliott Wave Chart
عضو المتداول العربي
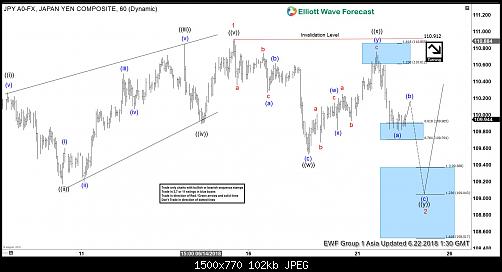
Elliott Wave View: USDJPY Support Around The Corner?
USDJPY short-term Elliott wave view suggests that the rally to 110.91 high ended Minor wave 1 & also the cycle from 5/29 low. The internals of that rally higher unfolded as Elliott wave leading diagonalwhere Minute wave ((i)) ended at 110.27 high in 5 waves, Minute wave ((ii)) pullback ended at 109.17, and Minute wave ((iii)) ended at 110.85 in 5 waves structure.
Down from there, Minute wave ((iv)) pullback ended at 109.89 and Minute wave ((v)) of 1 ended at 110.90 high in another 5 waves structure. Below from 110.9 high, pair is doing a Minor wave 2 pullback to correct cycle from 5/29 low in 3, 7 or 11 swings. So far the pullback looks to be unfolding as Elliott wave double three structure where Minute wave ((w)) ended at 109.53 with internals subdivision as zigzag correction. Up from there, Minute wave ((x)) bounce ended at 110.76 with internal subdivision of a double three. Near-term focus remains towards 109.36-109.04, which is 100%-123.6% Fibonacci extension area of Minute ((w))-((x)) to end the Minute wave ((y)) & also the Minor wave 2 pullback. Afterwards, the pair is expected to resume higher provided the pivot from 5/29 low (108.10) stays intact or should do a 3 wave bounce at least. We don’t like selling the proposed pullback.
USDJPY 1 Hour Elliott Wave Chart
عضو المتداول العربي
USDSGD Showing Incomplete Elliott Wave Structure To The Upside
June 26, 2018 By Hassan Sheikh (Edit)
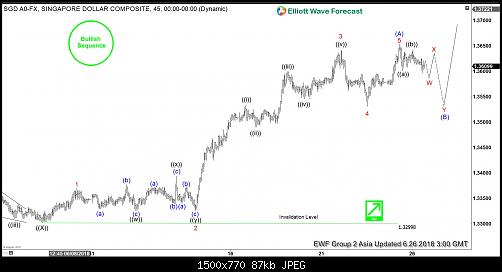
USDSGD short-term Elliott wave view suggests that the decline to 1.3299 on 6/07 low ended primary wave ((X)) pullback. Above from there, the pair rallied higher and went on to make a new high for this year creating 5 swing incomplete sequence to the upside from 1/25/2018 low. This sequence is represented by the bullish tag marked on the chart below.
The rally from 6/07 low appears to be in 5 waves & the structure looks impulsive. The 5 waves rally up from 6/7 low ended Intermediate wave (A) of an Elliott wave Zig-zag pattern at 1.3654. Up from Primary wave ((X)) low at 1.3299, the rally to 1.3371 high ended Minor wave 1. Then the pullback to 1.3326 low ended Minor wave 2 as double three structure.
Above from there, the pair made a strong rally in lesser degree 5 waves structure & ended Minor wave 3 at 1.3642 high. Down from there, the pullback to 1.3531 low ended Minor wave 4. Finally, the rally to 1.3654 high may have ended Minor wave 5 and also the Intermediate wave (A) of a Zigzag. The pair is now doing a pullback in Intermediate wave (B) to correct cycle from 6/07 low in 3, 7 or 11 swings before further upside is seen. We don’t like selling it and expect buyers to appear once Intermediate wave (B) pullback ends in 3, 7 or 11 swings for further upside, provided the pivot from 6/07 low (1.3299) stays intact.
USDSGD 1 Hour Elliott Wave Chart
عضو المتداول العربي
OIL Elliott Wave Impulse Structure Calling For More Upside
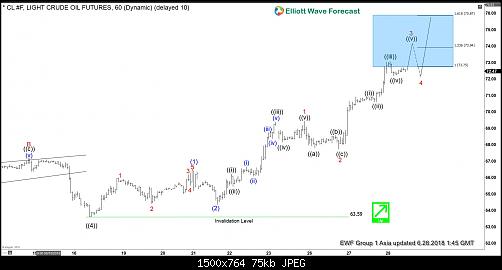
OIL short-term Elliott Wave view suggests that the decline to $63.59 on 6/18/2018 low ended primary wave ((4)) pullback. Above from there, the instrument has rallied to new highs already. And confirming the next extension higher taking place in primary wave ((5)). The rally higher from $63.59 low is taking the form of Elliott wave impulse structure with extension favoring more upside in the instrument.
Up from $63.59 low, the rally to $66.53 high ended intermediate wave (1) in lesser degree 5 waves structure. Down from there, intermediate wave (2) ended at $64.34 low. Then up from there, intermediate wave (3) remains in progress in another 5 waves structure within lesser degree cycles. And expected to show sub-division of 5 waves structure in each leg higher i.e Minor wave 1, 3 & 5. Above from $64.34 low, Minor wave 1 of (3) ended in 5 waves at $69.44. Minor wave 2 of (3) ended at 67.72 low. Minor wave 3 of (3) is expected to complete soon in-between 123.6%-161.8% Fibonacci extension area of Minor wave 1-2 at 72.75 – 73.94 area. Afterwards, the instrument is expected to do a pullback in Minor wave 4 of (3) before further upside extension is seen. We don’t like selling it into a proposed pullback.
OIL 1 Hour Elliott Wave Chart
عضو المتداول العربي
Facebook (FB) Elliott Wave Analysis: Pullback Remains In-progress
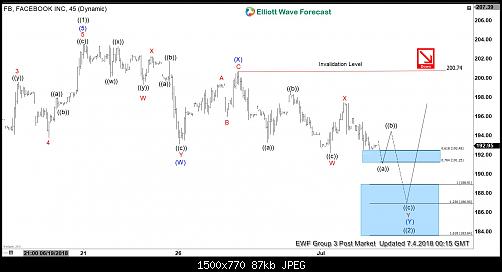
Facebook ticker symbol: $FB short-term Elliott wave analysis suggests that the rally to $203.55 ended primary wave ((1)). Down from there, the pullback in primary wave ((2)) remains in progress in 3, 7 or 11 swings to correct cycle from 3/26/2018 low. The internals of that pullback shows an overlapping structure thus suggesting that the correction takes the form of corrective structure i.e either (W),(X),(Y) or (W),(X),(Y),(X),(Z) structure within the intermediate degree.
Below from $203.55 high, the pullback is proposed to be unfolding as Elliott wave double three structure where Intermediate wave (W) ended at 193.11, Intermediate wave (X) ended at 200.75, and Intermediate wave (Y) of ((2)) remains in progress. The internal of Intermediate wave (W) also unfolded as a double three structure where Minor wave W ended in 3 swings at $199.31, Minor wave X ended $202.24 and Minor wave Y of (W) ended at $193.11 as a Flat. Up from there, intermediate wave (X) also unfolded in 3 swings as Elliott Zigzag structure with Minor wave A ended at $199.40, Minor wave B ended at $195.98 and Minor wave C of (X) ended at $200.83 high.
Down from there, intermediate wave (Y) of ((2)) remains in progress as another double three structure. Internals of that decline ended Minor wave W in 3 swings at $192.22 and Minor wave X ended at $197.45. Near-term focus remains towards $188.91-$186.90, which is 100%-123.6% Fibonacci extension area of Intermediate wave (W)-(X) to end primary wave ((2)) pullback. Afterwards, the stock is expected to find buyers for primary wave ((3)) higher ideally or should do a 3 waves reaction higher at least. We don’t like selling it into a proposed pullback.
Facebook ($FB) 1 Hour Elliott Wave Chart
عضو نشيط
يعطيك الصحه والعافيه على جهودك استمر هناك من يتابع
عضو المتداول العربي
SPX Elliott Wave Analysis: Calling Correction Lower
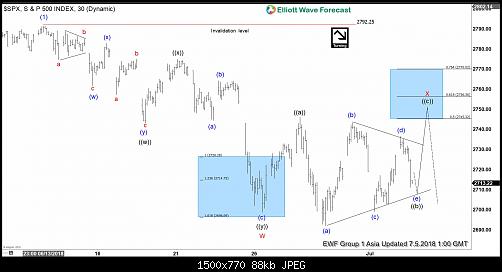
SPX short-term Elliott wave analysis suggests that the rally from 4/02/2018 low to $2792.25 ended the intermediate wave (1). Down from there, correction against that cycle remains in progress in 3, 7 or 11 swing structure. Also, it’s important to note here that the decline from $2792.25 peak shows an overlapping price action thus suggesting that the correction is taking place in a corrective manner i.e either Double three or Triple three structure.
Down from $2792.25, Minor wave W unfolded as a double three structure with a combination of 3,3,3 swings in each leg. Minute wave ((w)) of W ended at $2743.10, Minute wave ((x)) of W ended at $2774.86 and Minute wave ((y)) of W ended at $2698.67 low. Up from there, Minor wave X bounce remains in progress to correct cycle from 6/13 high ($2792.25) as a Zigzag structure where Minute wave ((a)) ended at $2746.09 and Minute wave ((b)) remains in progress as a running triangle structure. Near-term focus remains towards $2745.32-$2756.36, which is the 50%-61.8% Fibonacci retracement area of the cycle coming from $2792.25 high to complete Minute wave ((c)) of X. Afterwards, the index is expected to continue lower in Minor wave Y to correct cycle from 4/02/2018 low. We don’t like selling the proposed pullback.
SPX 1 Hour Elliott Wave Chart
عضو المتداول العربي
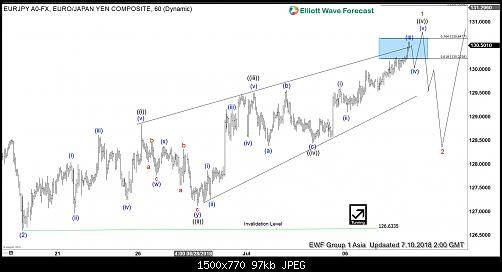
EURJPY Elliott Wave Analysis: Pullback can Provide Buying Opportunity
EURJPY short-term Elliott wave analysis suggests that the decline to $126.63 on 6/19 low ended intermediate wave (2) pullback. Up from there, intermediate wave (3) remains in progress as Elliott wave impulse. The internals of Minor wave 1 is unfolding as a leading diagonal with sub-division of 5-3-5-3-5. Up from $126.63 low, Minute wave ((i)) ended in 5 waves at $128.84. Minute wave ((ii)) pullback ended in 3 swings as a double three Elliott Wave structure at $127.12 low. Then rally from there ended Minute wave ((iii)) in another 5 waves at $129.5 high. Down from there, the pullback to $128.44 low ended Minute wave ((iv)) pullback as a Running Flat. Above from there, Minute wave ((v)) of 1 remains in progress in another 5 waves structure. The cycle looks mature but pair can extend higher 1 more time before it completes Minor wave 1. Afterwards, the pair is expected to do a pullback in Minor wave 2 in 3, 7 or 11 swings to correct cycle from $126.63 low before further upside towards $132.30-$133.63 area is seen. We don’t like selling the proposed pullback.
EURJPY 1 Hour Elliott Wave Chart
عضو المتداول العربي
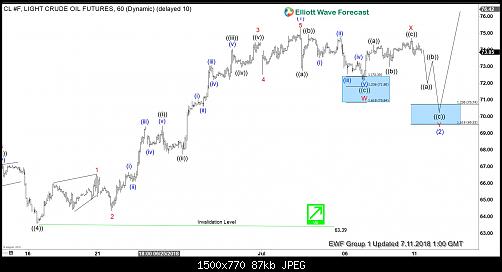
OIL Elliott Wave View: Providing Buying Opportunity Soon
OIL short-term Elliott Wave view suggests that the pullback to $63.39 on 6/18/2018 low ended primary wave ((4)). Up from there, the instrument rallied strongly to the upside and went on to make new high for the year. A rally from there took place in the form of an Impulse Elliott wave structure with extension with lesser degree oscillation showing the sub-division of 5 waves structure in each leg higher.
The internals of rally from $63.39 low ended Minor wave 1 in 5 waves at $66.53. Then the pullback to $64.34 low ended Minor wave 2 in 3 swings. Above from there, instrument rallied higher strongly in Minor wave 3 and ended another 5 waves at $74.46 high. Down from there the pullback to $72.51 low ended Minor wave 4. Then a rally to $75.27 high ended Minor wave 5 and also completed Intermediate wave (1) higher.
Below from there, the instrument is pulling back to correct cycle from 6/18 low ($63.39) in Intermediate wave (2) and expected to find buyers in 3, 7 or 11 swings. Currently, the instrument already did a 3 waves pullback in Minor wave W at $72.14, which is located inside $72.39-$71.82 blue box area and bounced higher. However, while it stays below the $75.27 high, the instrument is expected to do a double correction in 7 swings lower towards $70.74-$69.53, which is 123.6%-161.8% Fibonacci extension area of Minor wave W-X before it resumes the upside provided the pivot from $63.39 low stays intact. We don’t like selling it and expect Oil to stay supported as far as a pivot at $63.39 low is holding.
OIL 1 Hour Elliott Wave Chart
عضو المتداول العربي
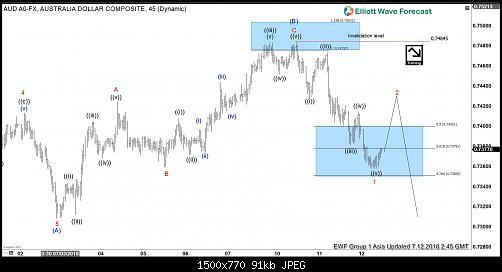
Elliott Wave Analysis: Is AUDUSD Ready to Resume Lower?
AUDUSD short-term Elliott Wave view suggests that the decline to $0.7308 low ended Intermediate wave (A) of a possible Zigzag structure coming from 6/06/2018 peak ($0.7676). Above from there, the 3 waves recovery to $0.7484 high ended Intermediate wave (B) bounce. The internals of that Intermediate wave (B) unfolded as Elliott Wave Zigzag correction where Minor wave A ended at $0.7424 high. Subdivision of Minor wave A of (B) unfolded as 5 waves where Minute wave ((i)) ended at $0.7342. Minute wave ((ii)) ended at $0.7312, Minute wave ((iii)) ended at $0.7404. Then Minute wave ((iv)) ended at $0.7368 and Minute wave ((v)) of A ended at $0.7424 high.
Down from there, Minor wave B ended at $0.7359 low. Up from there, Minor wave C of (B) ended at $0.7484 high with internals also unfolded in another 5 waves structure. Minute wave ((i)) ended at $0.7408. Minute wave ((ii)) ended at $0.7371, Minute wave ((iii)) ended at $0.7483. Then Minute wave ((iv)) ended at $0.7452 and Minute wave ((v)) of C ended at $0.7484 high. This rally also completed Intermediate wave (B) bounce there, after reaching the 100%-123.6% Fibonacci extension area of Minor A-B at $0.7475-$0.7503 area. Near-term, while bounces fail below there, expect pair to resume lower in Intermediate wave (C). However, a break below $0.7305 low remains to be seen to validate this view & until than a double correction higher in Intermediate wave (B) bounce can’t be ruled out. We don’t like buying it.
AUDUSD 1 Hour Elliott Wave Chart
عضو المتداول العربي
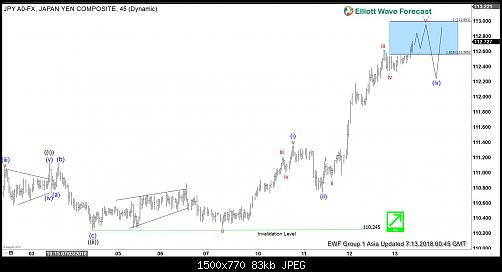
Elliott Wave Analysis: USDJPY Extending Higher As Impulse
USDJPY short-term Elliott Wave view suggests that the rally to 111.13 high ended Minute wave ((i)). Down from there, the pullback to 110.24 low ended Minute wave ((ii)). The internals of that pullback unfolded as a Flat Elliott Wave structure where Minutte wave (a) ended in lesser degree 3 swings at 110.77. Then bounce to 111.10 ended Minutte wave (b). And Minutte wave (c) of ((ii)) ended in 5 waves at $110.24 low.
Up from there, Minute wave ((iii)) remains in progress. And rally higher is showing the sub-division of 5 waves in lesser degree cycle suggesting an impulse structure. Above from $110.24 low, Minutte wave (i) of ((iii)) ended in 5 waves at 111.35. The pullback to 110.74 low ended Minutte (ii) of ((iii)). A rally higher from there is expected to complete Minutte wave (iii) of ((iii)) soon in another 5 waves in between 161.8%-200% Fibonacci extension area of Minutte wave (i)-(ii)) at 112.56 – 112.93. Afterwards, the pair is expected to do a pullback in Minutte wave (iv) of ((iii)) before another push higher is seen. We don’t like selling it. And as far as a pivot from 110.24 low holds pair is expected to see more upside.
USDJPY 1 Hour Elliott Wave Chart
عضو المتداول العربي
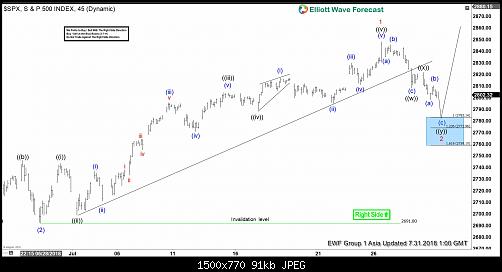
SPX Elliott Wave Analysis: Buying Opportunity Soon
SPX Short-term Elliott Wave analysis suggests that the pullback to $2691.80 low on 6.28.2018 ended intermediate wave (2). Above from there, the rally higher to $2848.03 peak ended Minor wave 1. The internals of that rally higher took the form as impulse Elliott wave structure where Minute wave ((i)), ((ii)) & ((iii)) unfolded in 5 waves structure & wave ((ii)) & ((iv)) unfolded in 3 swings corrective sequence.
Up from $2691.8 low, the rally higher to $2743.26 high ended Minute wave ((i)) in 5 waves. The pullback to $2698.95 ended Minute wave ((ii)) and the rally higher to $2804.53 high ended Minute wave ((iii)) as 5 wave structure. From there, Minute wave ((iv)) pullback ended at $2789.24 low and the rally higher to $2848.03 peak ended Minute wave ((v)) which also completed Minor wave 1.
The Index is now correcting cycle from 6.28.2018 low within wave 2 in 3, 7 or 11 swings before further upside is seen. Near-term focus remains towards $2783.14-$2759.10, which is 100%-161.8% Fibonacci extension area of ((w))-((x)) to end the 3 swings pullback in Minor wave 2. Buyers should appear from the above area either for new highs or for 3 waves reaction higher at least. We don’t like selling it.
SPX 1 Hour Elliott Wave Chart
عضو المتداول العربي
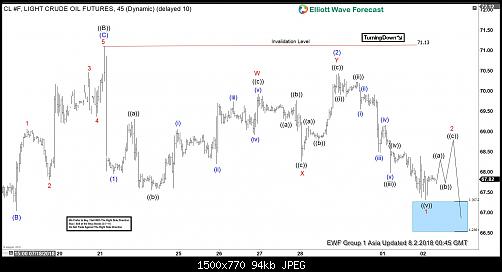
Elliott Wave Analysis: OIL Starting The Next Leg Lower
OIL short-term Elliott wave analysis suggests that the bounce to $71.13 high ended primary wave ((B)) bounce against 7/03/2018 peak ($75.27). Primary wave ((C)) lower currently remains in progress as Elliott Wave impulse structure looking for more downside. Down from $71.13 high, the decline to $67.96 low ended intermediate wave (1) in 5 waves structure. Above from there, the bounce to $70.43 high ended intermediate wave (2). The internals of Intermediate wave (2) unfolded as Elliott Wave double three structure where the initial rally to $69.92 completed Minor wave W of (2) as a Flat.
The subsequent pullback to $68.26 low ended Minor wave X of (2) as Elliott Wave Zigzag correction. Finally, the third leg higher in Minor wave Y of (2) ended at $69.92 high as Zigzag structure. Down from there, Intermediate wave (3) lower is in progress as an impulse and started nesting with Minor wave 1 ended in 5 waves at $67.31 low. Up from there, Minor wave 2 recovery remains in progress in 3, 7 or 11 swings & expected to fail below $70.43 high in first degree and against $71.13 in the second degree for more downside. As far as rally fails below 71.13, expect Oil to see further downside.
OIL 1 Hour Elliott Wave Chart