الأكثر زيارة
 رد مع اقتباس


عروض شركات الفوركس
 | |  | |  |  |  |

 عضو المتداول العربي
السلام عليكم ورحمة الله وبركاتهالمشاركة الأصلية كتبت بواسطة أحمد_الصالح

إنني أشارك المعلومات التقنية التي لها حقوق نشر ولا يمكن تداولها باللغة العربية دون تغيير بعض الأشياء التي يمكن أن تحدث فرقاً
عضو المتداول العربي
$AAPL Apple Expanded Flat from the 1/18/18 highs?
Longer term on monthly and weekly charts it obviously appears that Apple remains in an uptrend. I will try to explain where the instrument can reach in the expanded flat from the 1/18/18 highs. I will also provide an alternate scenario that will offer a similar buy zone before the next leg higher. Apple’s stock made new highs in January however we think that was part of a larger correction.
With the possible expanded flat from the January 18 highs, the Elliott Wave structure would be 3-3-5. That means the leg lower from the 1/18/2018 highs to the 2/9/2018 lows was three swings and not an impulsive five waves. From the 2/9/2018 lows, the same can be said for the three swing bounce into the new highs on March 13th 2018. From those highs, this leaves the incomplete structure still needing the wave three of the impulse to complete along with a relatively shallow bounce in wave four followed with a final wave five low that would show momentum divergence compared to the wave three. The conclusion is below the chart.
$AAPL Apple Daily chart
In conclusion.
The target area for the the expanded flat is shown in the blue box on the chart and is derived from a Fibonacci extension measurement using a chart platform Fibonacci extension tool. With the beginning point being at the 1/18/2018 highs, go down to the 2/2/2018 lows as point #2. From there up to the 3/13/2018 highs being point #3. That will give the extension area shown on the chart as the potential buy zone.
Finally as I mentioned in the first paragraph an alternative structure and target area will be a simple three swings lower from the 3/13/2018 highs. That would be a double three correction which counts as 3-3-3. This target area is not shown on the chart but I will tell you how to get it. Using the charting platform Fibonacci extension tool in the same manner as before. Begin at the 3/13/2018 highs as point #1 on down to the April 2nd lows as point #2. From there point #3 will be at the April 17th highs. That gives an extension area for a double three correction at the 159.66-147.74 area.
عضو المتداول العربي
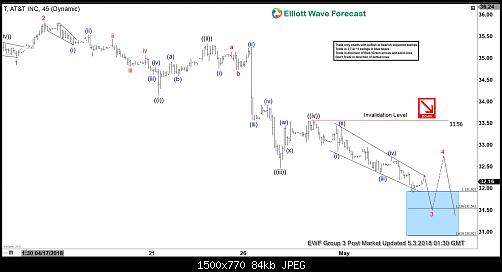
AT&T Elliott Wave View: Calling For 3 Wave Bounce
AT&T ticker symbol $T short-term Elliott Wave view suggests that the decline from 4/10 peak is unfolding as an Impulse Elliott Wave structure. In the impulsive structure, wave 1, 3, and 5 should show 5 waves internal subdivision.
Down from 4/10 peak ($36.39), Minor wave 1 ended in 5 waves structure at 35.02 low. Minor wave 2 bounce ended at 35.82 and Minor wave 3 is in progress with subdivision of 5 waves impulsive structure in the lesser degree. Down from 35.82, Minute wave ((i)) of 3 ended at 34.15, Minute wave ((ii)) of 3 ended at 35.33, Minute wave ((iii)) of 3 ended at 32.47, and Minute wave ((iv)) of 3 ended at 33.56 high.
Below from there, Minute wave ((v)) of 3 remains in progress. Minor wave 3 has reached the minimum number of swings and target, although a marginal low still can’t be ruled out towards $31.54 – $30.92. This is the 123.6%-161.8% Fibonacci extension area of ((v))=((i)). Afterwards, AT&T should end the 5 waves structure in Minor wave 3 and see a Minor wave 4 bounce in 3, 7 or 11 swings against 35.82 high before further downside resumes. We don’t like buying into the proposed bounce.
AT&T 1 Hour Elliott Wave Chart
عضو المتداول العربي
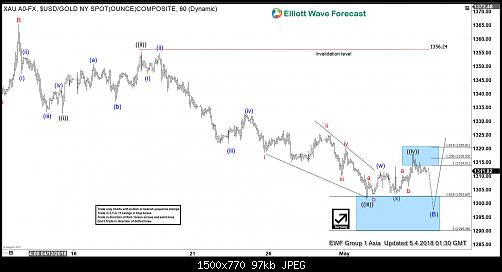
Elliott Wave View: Gold Entering Buying Areas
Gold short-term Elliott Wave view suggests that the rally to 4/11 high at 1365.24 ended Minor wave B. Below from there, the decline is unfolding as an impulse Elliott wave structure in Minor wave C of (B) lower. This structure forms a bigger FLAT Elliott Wave structure which starts from 1/25 peak. Internals of each leg to the downside, i.e. wave ((i)), ((iii)), and ((v)), shows a 5 waves structure subdivision in the lesser degree with extension in the third wave.
Down from 1365.24 high, Minute wave ((i)) of C ended in 5 waves at 1332.78. Minute wave ((ii)) of C ended as a Zigzag Elliott Wave structure at 1356.24. Minute wave ((iii)) of C ended in another 5 waves structure at 1301.5 low. Above from there, the bounce in Minute wave ((iv)) of C appears complete as a double three Elliott Wave structure at yesterday’s high at 1318.1. However, a break below 1301.5 low remains to be seen to confirm the next leg lower in Minute wave ((iv)) of C bounce. Until then, a double correction higher in Minute wave ((iv)) bounce can’t be ruled out.
The entire FLAT structure from 1/25 peak has reached 100% target at 1302.1, thus the cycle is mature and Intermediate (B) could end any moment. However, near-term, while bounces fail below 1318.1 high and more importantly the pivot from 1356.24 high stays intact, gold has scope to see another push lower. Potential target for Minute wave ((v)) of C, if it happens, comes at 1295.55 – 1297.92 which is the 1.236%-1.382% inverse Fibonacci extension of a Minute wave ((iv)). Afterwards, the metal is expected to resume the upside or should produce a bounce in 3 swings at least. We don’t like selling it.
Gold 1 Hour Elliott Wave Chart
عضو المتداول العربي
لا اخي احمد الصالح هذا خطاء موجات اليوت واحدة من اقوة من اقوة المدارس الفنية تسطيع من خلالها تحديد نقطة الانعكاس بدقة لا منتاهية لكن مشكلتها انها صعبة وموجات اليوت هو نظام مرن للغاية يمكن ان يظهر اكتر من رأي للزوج لكن بالنهاية جميعهم يوضحون الهبوط او الصعود نفسه انا عن تجربتي والله لم اذق طعم الربح الا عندما تعلمت موجات اليوت
عضو المتداول العربي
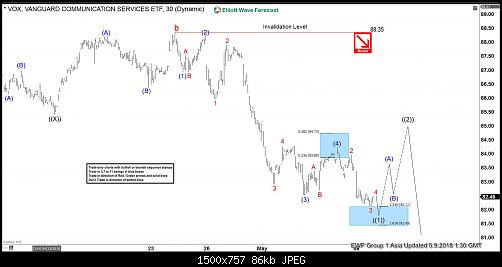
VOX Elliott Wave View: Calling For A Bounce Soon
Vanguard communication services ETF ticker symbol: VOX short-term Elliott Wave view suggests that the bounce to 88.35 on 4/24/2018 high ended cycle degree wave “b”. Below from there, the cycle degree wave “c” remain in progress as an Impulse Elliott Wave structure looking for more downside extensions.
Down from 88.35 high, Primary wave ((1)) is in progress as Impulsive structure where the internal distribution of each leg down is unfolding in 5 waves structure. Intermediate wave (1) ended in 5 waves structure at 86.93. Above from there, Intermediate wave (2) bounce ended at 88.21 as a Flat structure. Then down from there Intermediate wave (3) ended at 82.51 low. Subdivision of wave (3) unfolded as impulse structure of lesser degree where Minor wave 1 of (3) ended at 85.99, Minor wave 2 of (3) ended at 87.89, Minor wave 3 of (3) ended at 82.91, Minor wave 4 of (3) ended at 84.27, and Minor wave 5 of (3) ended at 82.51 low.
Above from there, the bounce to 84.23 high ended Intermediate wave (4) bounce as a zigzag correction. Intermediate wave (5) of ((1)) remains in progress in another 5 waves structure looking to extend 1 more push lower towards 81.45 – 82.11, which is inverse 123.6%-161.8% Fibonacci extension area of Intermediate wave (4). Afterwards, the instrument is expected to see a bounce in Primary wave ((2)) in 3, 7 or 11 swings to correct cycle from 4/24 high ($88.35) before further downside extension is seen. We don’t like buying it into a proposed bounce.
VOX 1 Hour Elliott Wave Chart
عضو المتداول العربي
السلام عليكم اخي الكريم
وشكرا لجهودك في نقل التحليل .
السؤال لماذ في هذه التحليلات نرى سيناريو واحد وليس عدة سيناريوهات فمثلا في الذهب فوق لم يذكروا ان اخر موجة ممكن ان تمتد الى xx.
وفي التحليل الاخير قد يصل الامتداد اكثر من 1.61 وقد يصل الى2.61.مع العلم ان التوصية تدعم ما اقول حيث يؤكدون على المتاجرة مع الاتجاه فقط .
قد تكون وجهة نظري خاطئة فلم اتعمق في اليوت كثيرا ولكني اطلعت عليه لمعرفة طريقة تشكل الموجات من دافعة ومتعاقدة ومثلثة وغيرها.
ولم لا تفتح ورشة خاصة بك بالتحليل ومتابعته حيث انك ملم بالتحليل الموجي فسيكون اضافة مميزة لنا ووجهة نظر اخرى نضيفها الى تحليلنا.
شكرا مرة اخرى لجهودك.
آخر تعديل بواسطة bilalmhd ، 09-05-2018 الساعة 08:04 PM
عضو المتداول العربي
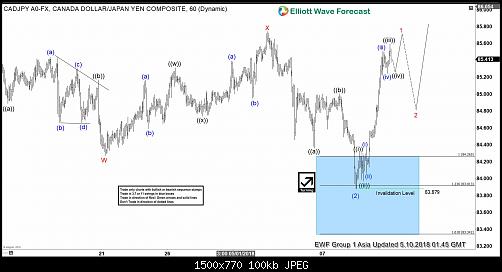
CADJPY Elliott Wave View: Calling Strength Higher
CADJPY Short Term Elliott Wave view suggests that the decline from 4/13 peak at 85.76 to 83.87 low ended Intermediate wave (2) as a double three Elliott Wave structure. The internal subdivision of the decline from 85.76 high shows an overlapping structure. This suggests the decline is corrective in nature. We label the correctin as W-X-Y.
Down from 4/13 peak (85.76), Minor wave W unfolded as a Zigzag Elliott wave structure. Minute wave ((a)) of W ended at 84.88, Minute wave ((b)) of W ended at 85.17 high, and Minute wave ((c)) of W ended at 84.27 low. Up from there, Minor wave X bounce also unfolded as a double three Elliott Wave structure. Minute wave ((w)) of X ended at 85.31, Minute wave ((x)) of X ended at 84.74 and Minute wave ((y)) of X ended at 85.74. The internal of Minor wave Y subdivided as a zigzag structure. Minute wave ((a)) of Y ended at 84.36, Minute wave ((b)) of Y ended at 85, and Minute wave ((c)) of Y ended at 83.87 low. The move lower to 83.87 also ended Intermediate wave (2) upon reaching 100%-123.6% Fibonacci extension area of Minor W-X at 83.91 – 84.26.
Above from there, the pair has made a strong rally to the upside in an impulse Elliott Wave structure. Due to the 5 waves impulse, it favors the continuation higher in Intermediate wave (3). However, a break above 4/13 high 85.75 is needed for the final confirmation of the next leg higher. Until then, a double correction lower in intermediate wave (2) still can’t be ruled out. Near-term, as far as dips remain above 83.87 low, expect pair to resume higher. We don’t like selling it.
CADJPY Elliott Wave 1 hour Chart
عضو المتداول العربي
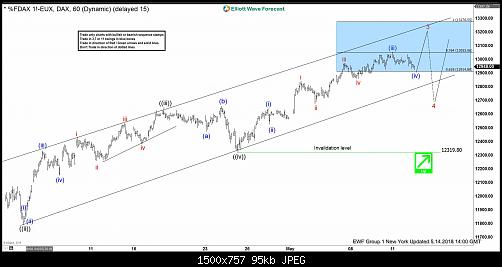
DAX Elliott Wave Analysis: Ending The Wave 3 Soon
DAX Elliott Wave view in shorter cycles suggests that the rally from March 26.2018 low (11704) is extending higher in Impulse sequence with extension in the 3rd wave. It’s important to note that an impulse structure should have internal subdivision of lesser degree 5 waves impulse. And in particular, DAX’s case, Minute wave ((i)), ((ii)) and ((v)) within wave Minor degree should have an internal subdivision of 5 waves impulse Elliott Wave structure of lesser degree.
The rally to 12152.62 ended Minute wave ((i)) of 3 in 5 waves structure, Minute wave ((ii)) of 3 ended at 11792.29 low. Then the rally to 12639.73 high ended Minute wave ((iii)) of 3 in 5 waves and pullback to 12319.80 ended Minute wave ((iv)) of 3 as a Flat correction. Above from there, the rally is unfolding in another 5 waves structure in Minute wave ((v)) of 3. Near-term, although the index has a minimum amount of swings in placed already to end the Minor wave 3. But while dips remain above 12319.80 low index is expected to extend 1 more push higher towards 13276.55 area approximately. Afterwards, the index is expected to do a pullback in Minor wave 4 in 3, 7 or 11 swings before further upside is seen. We don’t like selling it.
DAX Elliott Wave 1 Hour Chart
عضو المتداول العربي
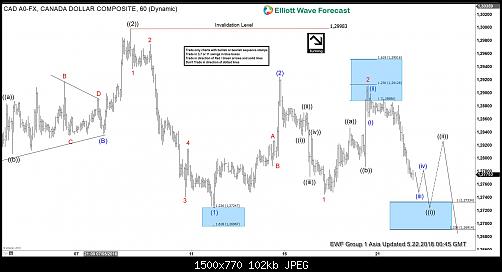
USDCAD Extending Lower As Elliott Wave Impulse
USDCAD short-term Elliott Wave view suggests that the bounce to 1.2998 on 5/08 high ended primary wave ((2)). Below from there, primary wave ((3)) remains in progress as an Impulse Elliott Wave structure looking for more downside extension. In Impulse wave, the subdivision of wave 1, 3, and 5 is also an impulse structure of a lesser degree. On the other hand, wave 2 & 4 are corrective in nature i.e double, triple three, Flat etc. In the case of USDCAD, Intermediate wave 1, 3 and 5 are impulse with sub-division of 1, 2, 3, 4 & 5 in Minor degree.
Down from 1.2998 high, the pair ended intermediate wave (1) in 5 waves at 1.2725 low. Then the bounce to 1.2924 high ended intermediate wave (2) as zigzag and the correction against 5/08 high (1.2998). Below from there, Intermediate wave (3) of ((3)) is in progress looking for more downside extension as an impulse. Minor degree wave 1 of (3) ended in 5 waves at 1.2745 low and the bounce to 1.2911 high ended Minor wave 2 of (3) as a zigzag correction. Near-term focus remains towards 1.2733-1.2691, 100%-123.6% Fibonacci extension area of wave 1 & 2, to end the Minute degree wave ((i)) of 3 lower. Afterwards, the pair should bounce in Minute wave ((ii)) to correct the cycle from 1.2911 high before further decline resumes. We don’t like buying the proposed bounces.
USDCAD 1 Hour Elliott Wave Chart
متداول متميز / مشرف سابق
thank u bro
عضو المتداول العربي
You are welcome
عضو المتداول العربي
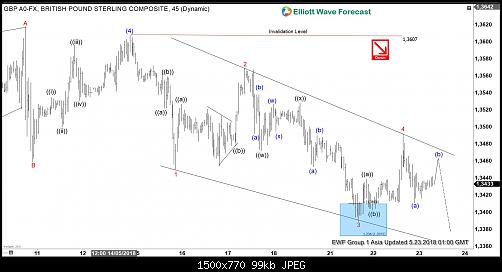
GBPUSD Elliott wave view in short-term cycle suggests that the decline from 4/17/2018 high (1.4377) is unfolding as an impulse Elliott wave structure where bounce to 1.3607 high ended Intermediate wave (4). Down from there, intermediate wave (5) remains in progress as Elliott Wave ending diagonal structure. Ending diagonal usually appears in the sub-division of wave (5) of impulse or wave (C) of a Zigzag correction with internal distribution of 3-3-3-3-3 corrective structure. It also commonly shows a wedge shape and has overlap between wave 1 & 4 when wave 4 may or may not enter the territory of wave 1.
In the case of GBPUSD, the decline from 1.3607 high to 1.3450 ended Minor wave 1 of (5) as a zigzag structure. Then the bounce to 1.3569 high ended Minor wave 2 of (5) in 3 swings as a zigzag structure. Down from there, the decline to 1.3389 low ended Minor wave 3 of (5) as Elliott wave double three structure. Above from there, the bounce to 1.3492 high ended Minor wave 4 of (5) which shows the overlap with Minor wave 1. Near-term, below from 1.3492 high, Minor wave 5 of (5) remains in progress which can extend to 1.3333-1.3295. This area is where Minor wave 5 = Minor wave 1 or 100%-123.6% Fibonacci extension area to end the cycle from 4/17/2018 peak. Afterwards, the pair is expected to do a bounce in 3 swings at least. We don’t like buying it into proposed bounces.
GBPUSD Elliott wave 1 Hour Chart
عضو المتداول العربي
The Hang Seng Index Larger Bullish Cycles
Firstly the Hang Seng index larger bullish cycles has been trending higher with other world indices. In April 2003 it put in a huge degree pullback low. From there the index rallied with other world indices again until October 2007. It then corrected the rally as did most other world stock indices. It ended this larger degree correction in October 2008. From those 2008 lows, the index shows a 5 swing sequence that favors further upside. Price has reached and exceeded the area of 29410 – 32040 which is the .618 – .764 Fibonacci extension of the 2008 to 2015 cycle.
The way this is measured is as follows. Use a Fibonacci extension tool on a charting platform. Point 1 will be at the beginning of the cycle at the 2008 lows. From there on up to the 2015 highs will be point 2. The point 3 will be down at the 2016 lows. As previously mentioned, the index in January 2018 saw the .618 – .764 Fibonacci extension of the 2008 to 2015 cycle. In most cases a fifth swing will end in this Fibonacci extension area however this index has been a bit more bullish. Analysis continues below the chart.
Hang Seng Index Weekly Chart
In conclusion . Currently the Hang Seng pullback from the 5th swing high ended the cycle up from the 2016 lows. It did a 3 swing pullback to the February 2018 lows to complete the 6th swing. At this point it is favored to remain above there during dips. Worst case if it remains below the January 2018 highs it can continue a pullback in the 6th swing in 3 more swings. This would make a possible 7, or 11 swings to correct the cycle up from the 2016 low which should be similar to the 2nd swing pullback of 2011. Afterward of completion of the 6th swing pullback it should see more upside in the 7th swing toward 36314.
عضو المتداول العربي
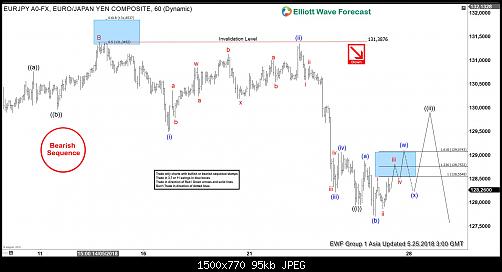
Elliott Wave Analysis: EURJPY Has a Bearish Sequence
EURJPY short-term Elliott Wave view suggests that the bounce to 5/14 high at 131.38 ended Minor wave B. Down from there, the decline is unfolding as Elliott wave impulsive structure in Minor wave C lower. The internal sub-division of each leg lower is showing 5 waves structure in lesser degree cycles, which is characteristic of an an impulse. Also, it’s important to note here that the below chart is showing a bearish sequence tag, which refers to the incomplete downward structure in the pair.
Below from 131.38 high the lesser degree Minutte wave (i) of ((i)) ended in 5 waves structure at 129.49. Above from there, the bounce to 131.35 high ended Minutte wave (ii) of ((i)) as a double three structure. Then the decline to 128.22 low ended in Minutte wave (iii) of ((i)) with another 5 waves structure. Up from there, the lesser degree Minutte wave (iv) of ((i)) ended at 129.06 high. Down from there, Minutte wave (v) of ((i)) ended at 127.94 low in another 5 waves. Above from there, the pair is correcting the short-term cycle from 131.38 high within Minute wave ((ii)) bounce which is epxected to fail in 3, 7 or 11 swings for further downside extension. We don’t like buying it into a proposed bounce.
EURJPY Elliott Wave 1 Hour Chart