الأكثر زيارة

 رد مع اقتباس


عروض شركات الفوركس
 | |  | |  |  |  |

 عضو المتداول العربي
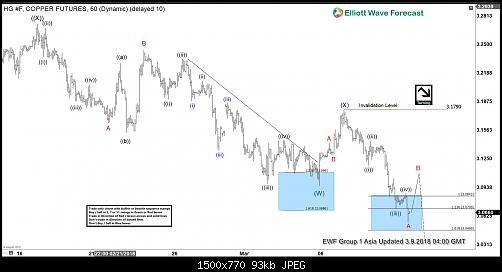
Elliott Wave Analysis: Copper at Risk of Further Weaknesses
Copper (HG_F) broke below $3.5 low ($3.095) earlier today. As a result, it shows a bearish sequence from 2/16 peak ($3.272), risking for further downside. Current short term Elliott Wave view in Copper suggests that the rally to $3.272 on 2/16 ended Primary wave ((X)). The decline from there is unfolding as a double three Elliott Wave structure where Intermediate wave (W) ended at $3.0955 on 3/5 and Intermediate wave (X) ended at $3.178 on 3/6. Intermediate wave (Y) remains in progress, and while near term bounces stay below $3.178, Copper should see further downside.
Internal of Intermediate wave (W) unfolded as a zigzag Elliott Wave structure where Minor wave A of (W) ended at $3.164 on 2/21, Minor wave B of (W) ended at $3.243 on 2/23, and Minor wave C of (W) ended at $3.0955 on 3/5. A zigzag structure has a 5-3-5 subdivision and the chart is showing a nice 5 waves impulse Elliott Wave structure subdivision within Minor wave A and Minor wave C.
Intermediate wave (X) correction from $3.0955 low has a subdivision of a zigzag Elliott Wave structure. Minor wave A of (X) ended at $3.142, Minor wave B of (X) ended at $3.129, and Minor wave C of (X) ended at $3.179. Decline from $3.179 appears to be unfolding as a zigzag with first leg Minor wave A subdivided as 5 waves. Minute wave ((i)) of A ended at $3.1175, Minute wave ((ii)) of A ended at $3.1445, Minute wave ((iii)) of A ended at $3.0705, Minute wave ((iv)) of A ended at $3.087, and Minute wave ((v)) of A appears complete at 3.055. Minor wave B bounce is in progress to correct cycle from 3/6 high in 3, 7, or 11 swing. While Minor wave B bounce stays below $3.179, expect Copper to extend lower.
Copper 1 Hour Elliott Wave Chart
عضو المتداول العربي
هل من جديد
IS THERE ANY UP DATES
THAT WAS SO INFORMATIVE THANK A LOT

عضو المتداول العربي
Will Trade War Weigh on the Market?
Trade war with China Hurt Global Economy
Last week global stock market slumped due to the prospect of all-out trade war which could destabilize global economy. US market closed sharply lower for the week with S&P 500 falling 5.6% and Dow Jones Industrial Average falling 6%. Asia markets also skidded with Nikkei 225 falling 6.3%, Hang Seng dropping 6.4%, and Shanghai Composite shed 6.4%. On Thursday, the White House moved forward with the long promised anti-China sanctions with the announcement of new tariffs on up to $60 billion in Chinese imports.
Trump said this measure is to penalize Beijing for allegedly stealing U.S companies’ intellectual property. The tariffs follow after the result of investigation in Chinese policies last August. The review found unfair practices in China, including restriction on foreign ownership without the transfer of technology. The administration says that the theft of intellectual property has been happening for decades. The new trade sanctions has identified more than 1000 Chinese products which can be potential target of 25% tariffs. The US is also trying to limit Chinese investment in the US and purse legal action against China at the World Trade Organization.
China’s promise to retaliate
Beijing has said that it is not afraid of a trade war, but it hopes to avoid it through continued dialog. On Friday, China gave initial counter proposal of 128 US products as potential retaliation targets. The products include wine, groceries, and aluminium scrap which have an import value of $3 billion. China’s response is still quite restrained so far as it tries to avoid a full blown trade war.
Despite potential retaliation by China, the White House believes China has more to lose in the event of a full blown trade war. The US imports billions more goods from China every year than it exports, creating a deficit of $375 billion in 2017. On Thursday Trump said that he has asked China to cut the deficit by $100 billion immediately. China is the third largest market for US exports and a very big buyer of American soybeans, corn, pork, and aircraft. In the event of a full-blown trade war, many US industries will be affected and no one will win.
Best and Worst Case of Trade War for Financial Market
In the best case scenario, the latest trade war declaration is Trump’s attempt to use it as a bargaining tactic to force China to negotiating table. We have an example from the last controversial import tariffs on steel and aluminium. In the previous steel tariff, six major trading partners have since been excluded, including the EU, Canada, South Korea, and Mexico. Thus, it’s possible that China’s tariff could be subject to revision and even exemptions after extensive talks with Chinese leadership. In this scenario, after the initial shakeout and fear in financial market, it can quickly recover and even extend the 9 year rally. However, Trump’s deal-making nature can also lead to miscalculation. In the worst case scenario, we could be in a full-blown trade war with increasing retaliatory tariff hikes and sanctions. In this case, global economy could come into halt and financial markets would have further correction.
Short Term Forecast for US Market
r
Our Elliott Wave Forecast for XLP, a consumer staple sectors ETF, suggests the market has further downside. The fund’s top holdings include stocks such as Procter & Gamble, Coca Cola, PepsiCo, and Walmart. XLP shows incomplete bearish sequence from 1.29.2018 peak ($58.95). It has further downside to at least $48.03 – $49.52 to complete Elliott Wave Double Three Structure. A double three Elliott Wave Structure has a WXY label. Down from 1.29.2018 high ($58.95), Intermediate wave (W) ended at $52.66 and Intermediate wave (X) ended at $55.84. Intermediate wave (Y) is in progress towards $48.03 – $49.52 before the instrument see support for a 3 waves bounce at least.
عضو المتداول العربي
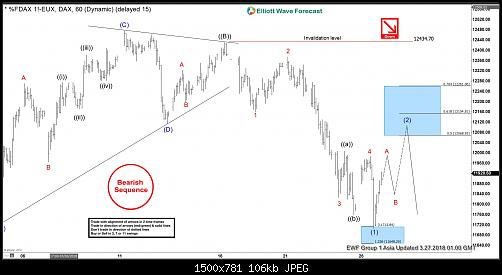
DAX Elliott Wave Analysis: Further Weakness Ahead?
Short term Elliott Wave view in DAX suggests Primary wave ((B)) ended at 12434.7 on 3.16.2018. The decline from there is unfolding as a 5 waves impulse Elliott Wave structure. Down from 12434.7, Minor wave 1 ended at 12160, Minor wave 2 ended at 12375.5, Minor wave 3 ended at 11827, Minor wave 4 ended at 11987.50, and Minor wave 5 is proposed complete at 11706.50. The 5 waves move lower ended Intermediate wave (1) of a higher degree.
Intermediate wave (2) bounce is in progress to correct cycle from 3.16.2018 high as a zigzag Elliott Wave structure. A zigzag is a 5-3-5 structure and has a label of ABC. Potential target for Intermediate wave (2) is 12068.9 – 12261.06, which is the 50 – 76.4% retracement of the decline from 3.16.2018 high. As far as pivot at 3.16.2018 high (12434.7) stays intact during the bounce, expect Index to extend lower again afterwards. We don’t like buying the Index.
DAX 1 Hour Elliott Wave Chart
عضو المتداول العربي
Bitcoin Elliott Wave Analysis Looking for Short Term Recovery
Bitcoin Elliott Wave Analysis in the short term is showing an interesting corrective structure suggesting a recover to take place after it finishes the current move.
The digital instrument is correcting the cycle from 03/18 low in 3 waves as a Zigzag structure which reached the 100% – 161.8% Fibonacci extension area $8093 – $7520 from where it’s expected to resume a new cycle to the upside or at least bounce in 3 waves as long as it remain above $7320 low.
Bitcoin Elliott Wave 1H Chart 03.27.2018
If Bitcoin manage to break above 03/23 peak then it will continue the bounce higher toward $9550 – $10080 area correcting the cycle from 02/20 peak before another pullback can be seen. In case the short term bounce fail and BTC breaks below $7320 low, then it will open an extension lower toward $6600 – $6000 area.
Bitcoin Elliott Wave views can be used for trading purpose if certain conditions are met which we do provide for our clients. Moreover, the blue box areas in our charts are a high frequency areas where the Markets are likely to end cycles and make a turn. Consequently, BTC most likely will react from current levels.
عضو المتداول العربي
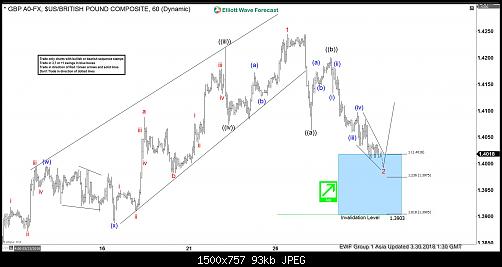
GBPUSD Elliott Wave View: Calling The Bounce Higher
GBPUSD Elliott Wave short-term sequence from 3/01 low (1.3709) ended as a Leading Diagonal structure in Minor wave 1 at 1.4248 high in 5 waves. Down from there, the pair is correcting that cycle in Minor wave 2 pullback in 3, 7 or 11 swings before it resumes the upside. So far pair is showing 3 swings back from the peak, which we are labeling as a Zigzag correction. Where Minute wave ((a)) ended with internal distribution of 5 waves at 1.4065 low and Minute wave ((b)) bounce ended in 3 swings at 1.4199 high.
Below from there, Minute wave ((c)) remain in progress with internal distribution of another 5 waves. Where Minutte wave (i) of ((c)) ended at 1.4133, Minutte wave (ii) of ((c)) ended at 1.4181. Then Minutte wave (iii) of ((c)) ended at 1.4059 and Minutte wave (iv) of ((c)) ended at 1.4095. And below from there, Minutte wave (v) of ((c)) remain in progress which has managed to reach the 100%-123.6% ext area of ((a))-((b)) already at 1.4018-1.3975 area. And soon as far as a pivot from 3/01 low (1.3709) remains intact pair is expected to resume the upside once again. We don’t like selling the pair into a proposed pullback and expect buyers to appear again at 1.4018-1.3975 for 3 wave bounce at least.
GBPUSD Elliott Wave 1 Hour Chart
GBPUSD Elliott Wave View: Calling The Bounce Higher
عضو المتداول العربي
SPX Elliott Wave View: Further Weaknesses Likely
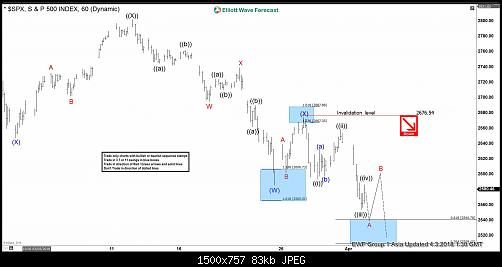
SPX Elliott Wave view suggests rally to 2801.90 on 3/13/2018 ended Primary wave ((X)). Decline from there is unfolding as a double three Elliott Wave structure where Intermediate wave (W) ended at 2585.89 and Intermediate wave (X) ended at 2674.22. Subdivision of Intermediate wave (W) unfolded as another double three of a lower degree where Minor wave W ended at 2694.59, Minor wave X ended at 2739.14, and Minor wave Y of (W) ended at 2585.89. Subdivision of Intermediate wave (X) unfolded as a zigzag Elliott Wave structure where Minor wave A ended at 2639.26, Minor wave B ended at 2601.81, and Minor wave C of (X) ended at 2676.54.
Intermediate wave (Y) is currently in progress as a zigzag Elliott Wave structure. A zigzag is a 5-3-5 Elliott Wave structure with ABC label. The subdivision of wave A is in 5 waves and the subdivision of wave C is also in 5 waves. In the case of SPX, decline from 2676.54 is unfolding as 5 waves impulse Elliott Wave structure where Minute wave ((i)) ended at 2593.06, Minute wave ((ii)) ended at 2659.07, Minute wave ((iii)) ended at 2553.80, and Minute wave ((iv)) is proposed complete at 2586.38.
Expect Index to extend lower 1 more time to end Minute wave ((v)) towards 2509.45 – 2540.78 and this next leg lower should also complete Minor wave A of a zigzag from 3.28.2018 high (2676.54). Afterwards, expect Index to bounce in Minor wave B in 3, 7, or 11 swing to correct cycle from 3.28.2018 high before the decline resumes. We don’t like buying the Index.
SPX Elliott Wave 1 Hour Chart
عضو المتداول العربي
Elliott Wave View: Copper Starts a New Leg Higher
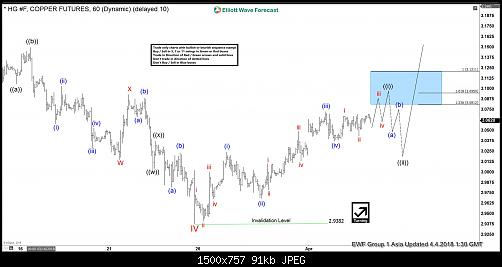
Short Term Elliott Wave view in Copper suggests that the decline to 2.938 on 3.26.2018 ended Minor wave IV. The metal started a new leg higher from there in Minor wave V. Subdivision of Minor wave V is unfolding as an impulse Elliott Wave structure. An Impulse Elliott Wave structure is a 5 waves structure where wave 1, 3, and 5 subdivision are also internally in 5 waves (impulsive). In the case of Copper, up from 2.938, Minutte wave (i) ended at 3.024, Minutte wave (ii) ended at 2.968, Minutte wave (iii) ended at 3.072, and Minutte wave (iv) ended at 3.037.
Near term focus is on 3.081 – 3.095 to complete Minutte wave (v). This next leg higher in Minutte wave (v) should end Minute wave ((i)) of a larger degree. Copper should then pullback in Minute wave ((ii)) in 3, 7, or 11 swing to correct cycle from 3/26/2018 low before the rally resumes, provided pivot at 2.938 low stays intact. We don’t like selling the proposed pullback and expect buyers to appear while Minute wave ((ii)) dips stay above 2.938 low.
Copper Elliott Wave 1 Hour Chart
عضو المتداول العربي
Elliott Wave Analysis: Further Strength in USDJPY
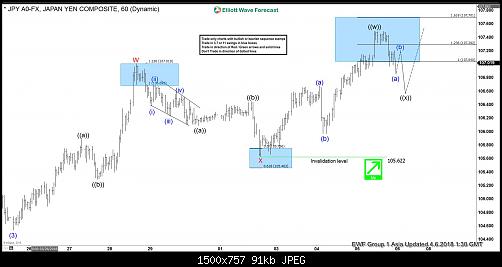
USDJPY short term Elliott Wave view suggests that the decline to 104.54 low on March 26 ended Intermediate wave (3). Wave (4) correction is in progress as a double three Elliott Wave Structure. A double three is a 7 swing corrective structure with WXY label. In the case of USDJPY, minor wave W of (4) ended at 107.01 and minor wave X of (4) ended at 105.62. As near term pullback stays above there, expect pair to extend higher within wave Y of (4).
Subdivision of Minor wave W of (4) in USDJPY unfolded as a zigzag Elliott Wave structure where Minute wave ((a)) ended at 105.9, Minute wave ((b)) ended at 105.29, and Minute wave ((c)) of W ended at 107.01. Subdivision of Minor wave X of (4) also unfolded as a zigzag Elliott Wave structure where Minute wave ((a)) ended at 106.09, Minute wave ((b)) ended at 106.45, and Minute wave ((c)) of X ended at 105.62.
Minor wave Y of (4) is currently in progress as a double three Elliott Wave structure where the rally from 105.62 ended at 107.49 in Minute wave ((w)). Expect pair to pullback within Minute wave ((x)) in 3, 7, or 11 swing to correct cycle from 4/3 low before the rally resumes.
USDJPY Elliott Wave 1 Hour Chart
عضو المتداول العربي
USDCAD Elliott Wave View: Calling Intraday Bounce
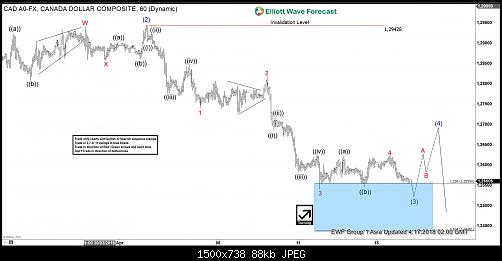
USDCAD Elliott Wave short-term view suggests that the bounce to 1.2942 high ended Intermediate degree wave (2). Then the decline from there is unfolding in an impulse sequence with an internal sub-division of each leg lower is showing 5 waves structure thus favored it to be an impulse. Below from 1.2942 high, Intermediate wave (3) remains in progress in 5 waves structure looking for 1 more push lower before a bounce in Intermediate wave (4) takes place.
Now let’s take a quick look at the short-term price action in the pair from 1.2942 high. The decline from there can be seen in 5 waves impulse sequence, where Minor wave 1 of (3) ended in 5 waves at 1.2744. Minor wave 2 of (3) ended 1.2818, Minor wave 3 of (3) ended in another 5 waves at 1.2543 low. And above from there Minor wave 4 of (3) bounce ended in 3 swings as a Flat structure at 1.2622 high. Below from there, the pair is expected to see another marginal push lower towards the inverse 1.236-1.618% ext area of Minor wave 4 at 1.2524-1.2493 area approximately to end the Minor wave 5 of (3) lower. However, in case of further downside extension pair can extend in Minor wave 5 of (3) towards wave 5=1 target area as well at 1.2418-1.2373 area before a bounce in intermediate wave (4) takes place against 1.2942 high. Which should then expected to fail in 3, 7 or 11 swings against 1.2942 high for further downside extension, so don’t like buying the pair into proposed bounces.
USDCAD Elliott Wave 1 Hour Chart
عضو المتداول العربي
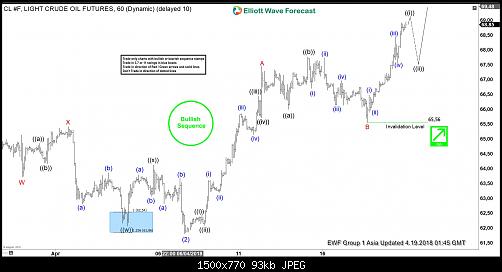
CL_F Elliott Wave short-term view suggests that the decline to 61.80 on 4/06/2018 low ended Intermediate wave (2). Above from there, Intermediate wave (3) remains in progress as Zigzag Elliott Wave structure. Looking to extend higher towards 70.43-72.47 area at a minimum. Up from 61.80 low, the instrument made a strong rally higher. And ended Minor wave A at 67.45 high in 5 waves structure.
The internals of Minor wave A unfolded in 5 waves impulse Elliott Wave structure where Minute wave ((i)) at 62.43, Minute wave ((ii)) ended at 62.09. Minute wave ((iii)) ended at 66.44 and Minute wave ((iv)) ended at 65.71 low. And Minute wave ((v)) of A ended at 67.45. The instrument then made a 3 waves correction lower in Minor wave B pullback as a Flat. Down from 67.45, Minute wave ((a)) at 66 low, Minute wave ((b)) at 67.76 and Minute wave ((c)) of B ended at 65.56 low.
Above from there, the instrument already broke to new highs confirming the next extension higher in Minor wave C of (3). Therefore looking for the extension higher towards 70.43-72.47 as noted above. Up from 65.56 low, the instrument is expected to end 5 waves in Minute wave ((i)) of C soon. And should see a pullback in Minute wave ((ii)) of C in 3, 7 or 11 swings before further upside is seen. We don’t like selling it.
CL_F Elliott Wave 1 Hour Chart
عضو المتداول العربي
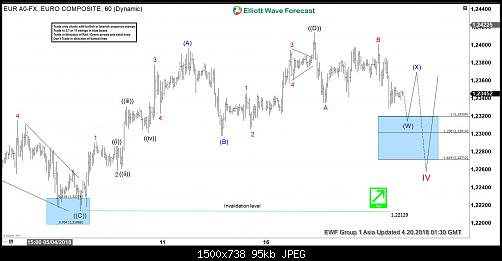
EURUSD Elliott Wave View: Still Trading Sideways
Short-term EURUSD Elliott Wave view suggests that the pair remains in a sideways triangle range between 1.2554 and 1.2153 levels as mentioned in the previous post here. Until we break out of the range, we look for the sideways price action to continue. Triangle doesn’t have any particular trend, but it is generally a continuation pattern, thus the pair likely thrust higher to continue the previous bullish trend after the sideways action is over. If we take a look at the previous cycle from January 2017 low. The pair shows a higher high sequence thus the pair is favored to trade higher once triangle consolidation is complete. It’s important to note that the Triangle is labeled as A,B,C,D,E.
Currently, we can be in the final stage of triangle structure in Cycle degree wave IV where the decline to 1.2214 low ended Primary wave ((C)) of IV. Above from there, wave ((D)) of IV ended at 1.2414 high. The internals of primary wave ((D)) is unfolding as zigzag Elliott Wave structure where Intermediate wave (A) ended at 1.2396. Afterwards, Intermediate wave (B) pullback ended at 1.2298 low and Intermediate wave (C) of ((D)) ended at 1.2414 high. Down from there, Primary wave ((E)) of IV remains in progress as double three Elliott Wave structure looking to end Intermediate wave (W) of ((E)) in 3 swings at 1.2320-1.2301 100%-123.6% Fibonacci extension area of Minor A-B. Pair should then correct in Intermediate wave (X) of ((E)) and ideally fail below 1.2414 for another extension lower before a thrust higher is seen. We don’t like selling the pair.
EURUSD Elliott Wave 1 Hour Chart
عضو المتداول العربي
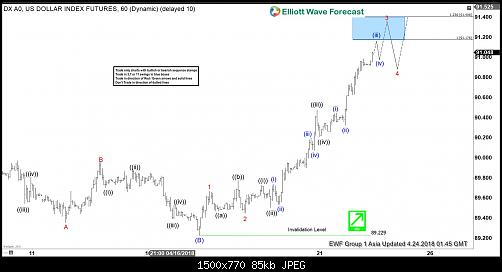
USDX Elliott Wave View: Extending Higher As Impulse
USDX Elliott Wave view in short-term cycle suggests that the decline to 89.22 ended Intermediate wave (B) as Elliott Wave Zigzag correction. Above from there, Intermediate wave (C) remains in progress as Elliott Wave Impulsive sequence with extension looking for further extension higher. The internal distribution of each leg consists of 5 waves structure with extension in the third wave thus we favor the structure to be an impulsive sequence.
Up from 89.22 low, Minor wave 1 of (C) ended in 5 waves at 89.66, Minor wave 2 ended as a Flat at 89.45 low. Then above from there Minor wave 3 remains in progress. The internal of Minor wave 3 is unfolding as an Impulse Elliott Wave sequence with extension where Minute wave ((i)) ended at 89.72, Minute wave ((ii)) ended at 89.51, Minute wave ((iii)) ended at 90.47 high, and Minute wave ((iv)) ended at 90.21 low. Above from there, Minute wave ((v)) of 3 remains in progress looking to extend higher 1 more push towards 91.17 – 91.40 area approximately to end 5 waves in Minor wave 3. Afterwards, the index should do a Minor wave 4 pullback in 3, 7 or 11 swings before further upside is seen. We don’t like selling it into a proposed pullback.
USDX Elliott Wave 1 Hour Chart
عضو نشيط
السلام عليكم ورحمة الله وبركاته
أخي العزيز لم أقرأ الكثير بموضوعك الذي تُقدم به مشكوراً مجهودك بالمجان
الا أن لي مأخذين عليه
الأول :- لماذا تكتب باللغة الإنجليزية وأنت عربي ، والمنتدى عربي ، والقرآن عربي ، واللغة العربية فضلها الله على سائر اللغات ..؟!
الثاني :- لماذا تعتمد على موجات ايليوت بالتداول وهي باعتقادي والكثيرين محل دراسة فقط ولا يثبت بعد امكانية الإعتماد عليها كأسلوب تداول ..؟!
أخيراً أرجوا من الله أن يكون ردك باللغة العربية لتسهيل عملية التواصل ، ولما تحمله هذه اللغة من قوة تُمكنك من وصف وتفسير أي شيء وكل شيء
تحياتي لك وللجميع ، ورشة موفقة
عضو المتداول العربي
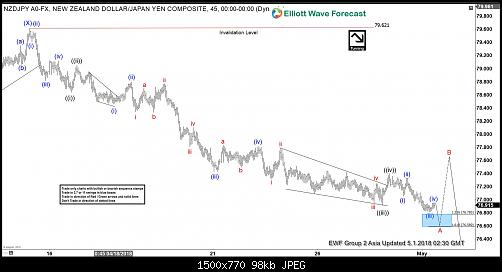
NZDJPY Elliott Wave View: Impulse Sequence In Progress
NZDJPY Elliott Wave view in short-term cycles suggests that the bounce to 79.62 high ended Intermediate wave (X). Down from there, Intermediate wave (Y) remains in progress as a Zigzag Elliott Wave structure in which the first leg of the zigzag (Minor wave A) is unfolding as an impulse Elliott Wave structure looking to see another push lower before ending Minor wave A.
Down from 79.62 high, Minute wave ((i)) of A ended at 78.63. Minute wave ((ii)) of A ended at 79.06. Minute wave ((iii)) of A ended at 76.91 and Minute wave ((iv)) of A ended at 77.4 high. As an impulse, the subdivision of Minute wave ((i)), ((iii)), and ((v)) in Minor wave A has an internal distribution of smaller degree 5 waves. Minute wave ((v)) of A remains in progress as 5 waves structure towards 76.78-76.58, which is inverse 1.236-1.618% Fibonacci extension area of a Minute wave ((iv)).
Afterward, the pair can complete Minor wave A and end cycle from 4/13 peak, then it should bounce in Minor wave B to correct cycle from 4/13 high (79.62) in 3, 7 or 11 swings. As far as Minor wave B rally fails below 79.62 high, the pair should resume lower again in Minor wave C of (Y). We don’t like buying the proposed rally.
NZDJPY Elliott Wave 1 Hour Chart