الأكثر زيارة

 رد مع اقتباس


عروض شركات الفوركس
 | |  | |  |  |  |

 عضو المتداول العربي
FTSE Elliott Wave Analysis: Ended Correction
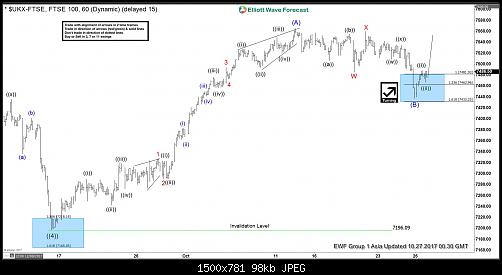
FTSE Elliott Wave view suggests that decline to 7199.5 ended Primary wave ((4)). Up from there, the rally is unfolding as an impulse Elliott Wave structure where Minor wave 1 ended at 7327.5 and pullback to 7289.75 ended Minor wave 2. Rally to 7494.34 ended Minor wave 3, and pullback to 7473.12 ended Minor wave 4. Minor wave 5 ended at 7565.11 and this also ended Intermediate wave (A) of a zigzag Elliott Wave structure from 9/15 low (7199.5).
Intermediate wave (B) pullback unfolded as a double three Elliott Wave structure where Minor wave W of (B) ended at 7485.42, Minor wave X of (B) ended at 7560.04 and Minor wave Y of (B) ended at 7437.42. Near term, while pullbacks stay above 7347.42, and more importantly as far as pivot at 9/15 low (7196.09) stays intact, expect Index to extend higher. We don’t like selling the Index.
FTSE 1 Hour Elliott Wave Analysis
عضو المتداول العربي
DAX Intra-Day Elliott Wave Analysis
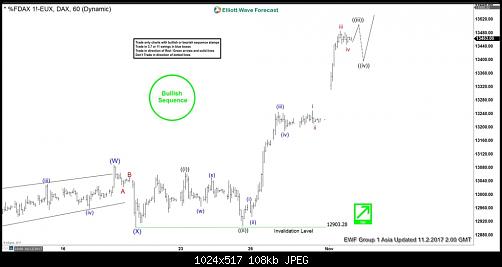
The rally in DAX from 8/29 low is unfolding as a double three Elliott Wave structure where Intermediate wave (W) ended at 13089 and pullback to 12903 ended Intermediate wave (X). Up from there, the rally from 12903 low looks to be unfolding as an impulse. Minute wave ((i)) ended at 13066 and pullback to 12906.5 ended Minute wave ((ii)). Minute wave ((iii)) remains in progress and expected to end with one more leg higher. Afterwards, Index should pullback in Minute wave ((iv)) before another leg higher in Minute wave ((v)) of A. We don’t like selling the Index in any proposed pullback. For the impulse view to remain valid, ideally Minute wave ((iv)) pullback later should not retrace more than 50% of Minute wave ((iii)). Near term, while pullbacks stay above 12903 low, expect the Index to extend higher.
DAX 1 Hour Elliott Wave Analysis
عضو المتداول العربي
First Solar FSLR Recovery in Progress
First Solar (NASDAQ: FSLR) designs and manufactures solar modules using a proprietary thin film semiconductor technology. The company has developed, financed, engineered, constructed and currently operates many of the world’s largest grid-connected PV power plants.
First Solar relies almost entirely on utility-scale projects which accounts for over half of the U.S. solar market and can be affected by the potential solar import tariffs by the Trump administration. However, preparation were already made to avoid such a step-back and the company booked 4.5 GW of panel and system sales in the previous quarter, more than it makes in a year.
After last month’s better than expected earnings report and the fact that utilities and project developers are booking tariff-free panels to lock up supply in 2018 helped First Solar shares to jump over 20% and the technical picture for its stock is looking for more gains in the coming months.
FSLR Monthly Chart
First Solar saw an impressive 1100% rally in the first 19 months after its IPO ($20) before it started declining from 2008 peak ($317) like the rest of the stock market around that period. The 3 swings decline lasted 4 years and erased all the gains saw previously until the stock found a bottom in May 2012 at $11.43. Up from there, FSLR bounced higher either to start new bullish cycle to the upside or at least to correct the decline toward the 50% – 61.8% Fibonnacie retracement area $164 – $200.
FSLR Elliot Wave Weekly Chart
Up from May 2012 low, FSLR rallied in a corrective 7 swing sequence which indicates the stock is still in a correction stage then it did another double three to the downside which ended on April of this year. Afterward, the stock started another rally which still needs to break above 2014 peak to target equal legs area $88 – $103 as a first step of a larger move.
In the short term, FSLR is looking to reach $69.1 – 72.5 area where a 3 waves pullback can take place before it can resume the move higher, consequently the stock should remain supported while holding above 45.26 low.
Recap
First Solar booked most of its production for the next two years, which gives it a tremendous amount of certainty and could present a good investment. Technically the stock is still recovering from the fall since 2008 peak but will it be a fast recovery or a slow sideways bounce? Only time will tell but the overall picture remain in favor of the Solor Energy sector and companies like First Solar or SunPower (NASDAQ:SPWR) are have more potential in the future.
عضو المتداول العربي
CADJPY Elliott Wave Analysis 11.14.2017
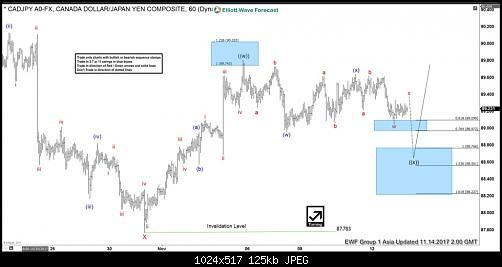
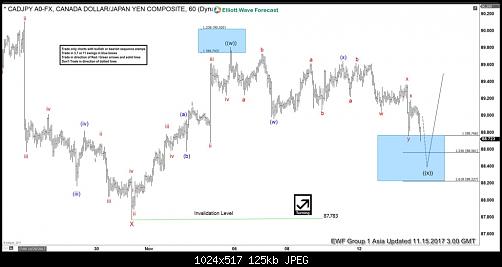
CADJPY Elliott Wave view suggests that the decline to 87.78 ended Minor wave X. Pair starts a new rally from there as a double three Elliott Wave structure where Minute wave ((w)) ended at 89.8. Minute wave ((x)) pullback is currently in progress to correct cycle from 10/31 low in 3, 7, or 11 swing before the rally resumes, provided that pivot at 10/31 low (87.78) stays intact. Subdivision of Minute wave ((x)) is unfolding also as a double three Elliott Wave structure where Minutte wave (w) ended at 88.96 and Minutte wave (x) ended at 89.64. Near term, while bounces stay below 89.8, expect pair to extend lower in Minutte wave (y) of ((x)) towards 88.56 – 88.76 area before pair resumes the rally higher or at least bounce in 3 waves. We don’t like selling the pair.
CADJPY 1 Hour Elliott Wave Analysis
عضو المتداول العربي
SPX Bounce from the 8/21 lows is Impulsive
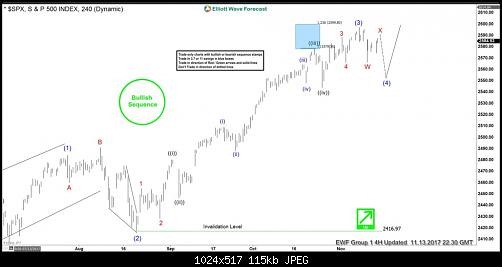
Hi fellow traders. The $SPX Bounce from the 8/21 lows is impulsive as the title suggests and does display the usual characteristic traits of an Elliott Wave impulse. Looking back previously before this 8/21 date, the stock index is within an obvious uptrend in multiple degrees. For purpose of this particular blog we are mainly focused upon this particular time frame in four hours up from that aforementioned 8/21 low. The point is to try to tell and show what to look for ideally happening in the near term to help get a shorter term trader in position to capitalize on the pending and conditional dip that can be seen correcting the uptrend cycle from the 8/21 lows. That is to identify the area the wave (4) pullback can reach. Longer term traders and investors should be able to stand back and enjoy the benefit on being long in the uptrend.
That being said, the dip to 2566 from the 2597 highs of 11/7 , coupled with other correlated instruments was strong enough in our system to suggest it was correcting the cycle from the 8/21 wave (2) lows. The one condition mentioned above is there is an ongoing bounce in wave X shown in the graphic chart below that currently shows an equal legs extension area at 2594 where it may or not reach or as well it can even exceed. What the bounce will need to do is fail below the 11/7 highs at 2597 and turn lower for another swing below 2566 otherwise there is a risk that the wave (3) is extending higher. This is very common for an Elliott Wave three of any degree to extend with the trend and is just another reason a trader should not trade into a correction against the trend. If the dip materializes as proposed then great, buy into it and join the uptrend on the right side of the market.
Finally and back to what the point here is identifying the area the wave (4) dip can reach is as per the following. After the proposed wave X ends and it breaks below 2566 again, a measurement from the wave (3) highs of 11/7 down to the 2566 lows then up to the wave X highs will give the equal legs to 1.236 extension area for the dip in wave Y of (4). The Fibonacci extension will usually be more precise as compared to the usual Fibonacci retracement area in a wave four. As it stands now while below the 11/7 highs a typical wave four will retrace .236 to .382 of a wave three. That area comes in at the 2554-2528 region.
عضو المتداول العربي
Petroyuan Can Accelerate the De-Dollarization
The move away from Petrodollar
In 1974, US President Richard Nixon and King Faisal from Saudi Arabia struck a deal. This deal gave birth to the petrodollar system which still lasts until this day. The deal involves Saudi Arabia selling oil to its largest buyer back then, the U.S. In turn, the U.S. provides Saudi Arabia with money, military aid, and political support. The Saudis then reinvest billions of their petrodollar revenue back in U.S. Treasury bonds.
Since that seminal deal, Oil has traded in U.S. dollars almost exclusively, even when the buyers and producers are not American. The consequence of the dollar-for-oil trade is massive. It creates a huge demand for dollars, therefore establishing US Dollar’s hegemony in world trade. The arrangement has also allowed the U.S. to run a huge deficit and borrow money at very low interest rates to finance the U.S. spending and growth for the next 4 decades.
In recent years however, several nations have tried to abandon petrodollar. The incentives come from the increasingly used tactic of economic sanctions by the Western nations. Washington for example has targeted the Russian economy and imposed an economic burden to force Moscow into submission. In response, Russia has gradually moved away from the reliance to U.S. dollar. Russia worked with China to create alternative to the SWIFT payment system which is not controlled by Western interest. China and Russia have also agreed to use yuan and ruble for bilateral oil trading. A non-dollar trading system will allow countries to bypass and counter the impact of the sanctions. This move away from petrodollar has lessened the US ability to use the dollar as a weapon.
The Alternative of Petroyuan
Today, China is replacing the U.S. position as the top oil importer. From China’s point of view, it makes sense to use Yuan to price the world’s most important commodity. Just as petrodollar creates more demand for US dollar and support U.S. economy in the past 4 decades, petroyuan can also stimulate demand for things in China, whether goods and services, Panda bonds (yuan-denominated bonds), or securities.
To this end, Beijing is said to introduce oil futures benchmark denominated in Yuan in coming months. In July, the Shanghai INE (International Energy Exchange) has completed four-step trial in crude oil futures denominated in yuan. The INE would try to launch it by the end of the year. In the bid to establish petroyuan, in recent years China has also been actively courting the biggest oil producer, Saudi Arabia, to accept Yuan as the currency for oil trade. Many believe that as soon as Saudi Arabia moves to accept Yuan for oil trade, the rest of the oil players may follow suit. The issue however is China’s closed capital market and the inability to move Chinese currency out of the country. To alleviate this fear, China is said to provide an option for the oil producers to convert the Yuan to physical gold in Shanghai / Hong Kong exchange.
For sure, it won’t be easy to replace the dollar and there are still challenges as China needs to convince major countries to participate. In addition, Saudi Arabia can meet a blowback from their long-term ally the U.S. Recent development however suggests Saudi Arabia’s relationship with China is getting warmer. In May this year, King Salman oversaw the signing of deals with China worth $65 billion. King Salman also publicly said he hoped China can play a greater role in Middle East affairs. Then in August this year, China and Saudi Arabia inked another $70 billion of new deals. The deal includes investment, trade, energy, postal service, communications, and media.
Although U.S Dollar may not lose its status as the world reserve currency overnight, the launching of Yuan-denominated crude oil benchmark can mark a new beginning of the end of Petrodollar.
What happens to dollar and Oil with the introduction of Petroyuan?
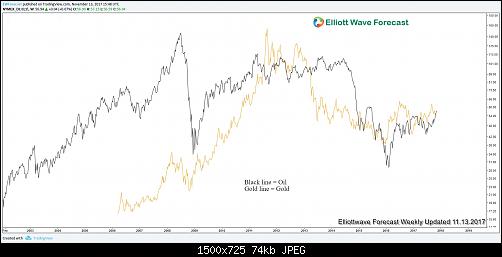
An overlay of weekly chart between Oil (CL_F) and inverted DXY (Inverted US. Dollar) above shows a strong positive correlation between the two. When Oil prices go up, the inverted DXY chart also goes up which means that US dollar declines. They also have the same major tops and bottoms in 2008, 2011, and 2015.
The introduction of Yuan-denominated oil futures benchmark by China in coming months may represent a big shift in the global order. It could potentially start the progressive decline in US Dollar. To start, there will be lesser demand for U.S. securities across the board. Secondly, Carl Weinberg, chief economist at High Frequency Economics estimates it will take away between $600 billion and $800 billion worth of transactions out of the dollar.
Based on the correlation chart above, we should also see Oil priced in dollar starting to rise as the U.S. dollar lose its value. Not only that, we should also see Gold and other commodity’s price rallying in dollar’s term. The chart below shows an overlay between Gold and Oil which also shows a positive correlation
عضو المتداول العربي
CADJPY Short Term Elliott Wave Analysis
CADJPY Short Term Elliott Wave view suggests that Minor wave X ended at 87.78. Up from there, pair rallies as a double three Elliott Wave structure where Minute wave ((w)) ended at 89.8 and Minute wave ((x)) is in progress. Subdivision of Minute wave ((x)) takes the form of a double three Elliott Wave structure. Decline to 88.96 ended Minutte wave (w) of ((x)) and Minutte wave (x) of ((x)) ended at 89.64. Near term, pair has reached the 100% area from 11/6 peak so the minimum target for Minute wave ((x)) has been reached. However, another leg lower still can happen towards 88.22 – 88.56 area before Minute wave ((x)) ends and pair resumes the rally higher or bounce in 3 waves at least. As far as pivot at 87.78 stays intact, expect pair to turn higher. We don’t like selling the pair.
CADJPY 1 Hour Elliott Wave Analysis
عضو المتداول العربي
YM_F Dow Short Term Elliott Wave view
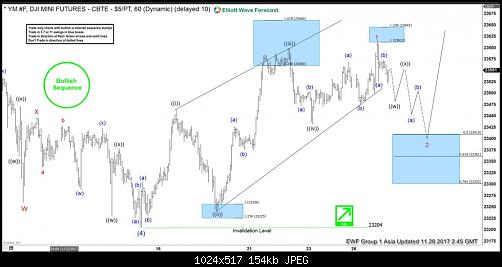
YM_F Dow Short term Elliott Wave view suggests that Intermediate wave (4) ended at 23204. Rally from there is unfolding as a leading diagonal Elliott wave structure. Minute wave ((i)) ended at 23464, Minute wave ((ii)) ended at 23241, Minute wave ((iii)) ended at 23599, Minute wave ((iv)) ended at 23432, and Minute wave ((v)) ended at 23616. The 5 waves leading diagonal rally also ended a higher degree Minor wave 1.
Minor wave 2 pullback is currently in progress to correct cycle from 11/15 low (23204) in 3, 7, or 11 swing before Index resumes the rally higher or at least bounce in 3 waves. The 50 – 76.4% retracement at 23302 – 23410 could be a potential area where Minor wave 2 may end, although the pullback doesn’t need to go that low. We don’t like selling the proposed pullback and expect buyers to appear once Minor wave 2 pullback is complete in 3, 7, or 11 swing provided pivot at 23204 low stays intact.
YM_F Dow 1 Hour Elliott Wave Chart
عضو المتداول العربي
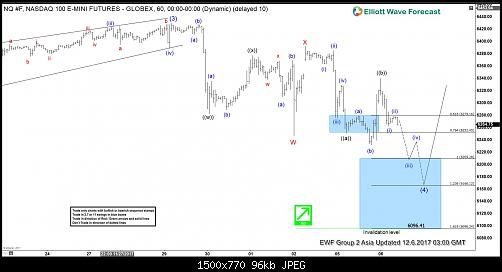
Nasdaq Elliott Wave Analysis 12.6.2017
Nasdaq Intraday Elliott Wave view suggests that Intermediate wave (3) ended with the rally to 6429.5. Intermediate wave (4) pullback remains in progress to correct cycle from 8/21 low (5753.6) in 3, 7, or 11 swing before the rally resumes. Intermediate wave (4) is unfolding as a double three Elliott wave structure where Minor wave W ended at 6246 and Minor wave X ended at 6391.75. Minor wave Y of (4) is currently in progress towards 6096.24 – 6209.28 area. Afterwards, Index should resume the rally higher or bounce in 3 waves at minimum. We don’t like selling the proposed pullback and expect buyers to appear from the above area for at least a 3 waves bounce provided that pivot at 8/21 low (5753.6) stays intact.
NQ_F Nasdaq 1 Hour Elliott Wave Chart
عضو المتداول العربي
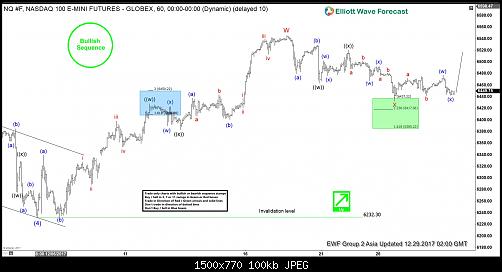
Nasdaq Elliott Wave Analysis: More Upside Favored While Above 6232.3
Nasdaq Short Term Elliott Wave view suggests that the Index remains bullish as far as pullbacks stay above Intermediate wave (4) at 6232.3. Rally from Intermediate wave (4) low unfolded as a double three Elliott Wave structure where Minor wave W ended at 6545.75 and Minor wave X is proposed complete at 6432.25 in the green box. Internal of Minor wave W unfolded as a double three Elliott Wave structure where Minute wave ((w)) ended at 6427.75, Minute wave ((x)) ended at 6383, and Minute wave ((y)) of W ended at 6545.75.
Internal of Minor wave X unfolded as a double three Elliott Wave structure where Minute wave ((w)) ended at 6463.25, Minute wave ((x)) ended at 6520.75, and Minute wave ((y)) of X ended at 6432.25. Near term, while dips stay above 6432.25, but more importantly as far as pivot at 12/5 low (6232.3) stays intact, expect Index to extend higher. Unless already long with a risk free trade from the green box area, we prefer to wait for the Index to break above Minor wave W at 6545.75 before buying the dips again. Until the Index breaks above Minor wave W at 6545.75, a double correction in Minor wave X still can’t be ruled out.
If the Index breaks below 12/26 low (6432.3) from here, then it could either form a triple three or double three correction from 12/19 peak. In the case of a triple three correction, Index should then extend lower to 6371 – 6391 area to end Minor wave X before the rally resumes. In the case of a double three correction, then Index can go to as low as 6234 – 6361 to end Minor wave X before buyers appear for at least a 3 waves bounce.
Nasdaq 1 Hour Elliott Wave Chart
عضو المتداول العربي
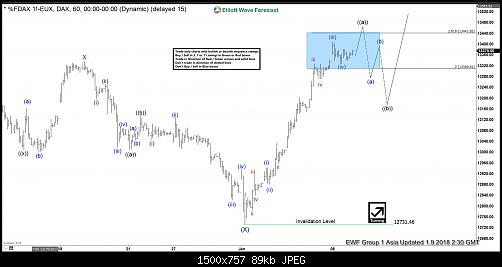
DAX Elliott Wave Analysis: Ending 5 Waves
DAX Short Term Elliott Wave view suggests that the Index ended Intermediate wave (X) pullback at 12731.46. The rally from there is unfolding as a 5 waves impulse Elliott Wave structure where Minutte wave (i) ended at 12943, Minutte wave (ii) ended at 12881.5, Minutte wave (iii) ended at 13408.5, and Minutte wave (iv) is proposed complete at 13328.5. Index has scope to extend 1 more leg higher in Minutte wave (v) before ending 5 waves up from 1/2 low (12731.46).
The move higher in Minutte wave (v) should also end Minute wave ((a)) of a larger degree. Afterwards, Index should pullback in Minute wave ((b)) to correct cycle from 1/2 low before the rally resumes. Chasing the Index higher from here is risky, but we don’t like selling the Index either. We expect buyers to appear during Minute wave ((b)) pullback in 3, 7, or 11 swing for an extension higher as far as pivot at 1/2 low (12731.46) stays intact.
DAX 1 Hour Elliott Wave Chart
عضو المتداول العربي
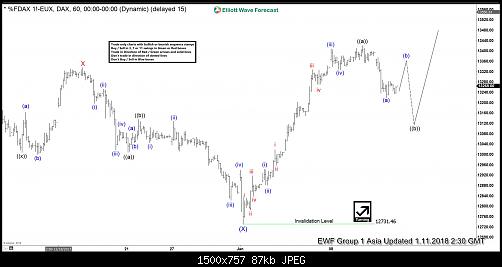
DAX Elliott Wave Analysis: Correction in Progress
DAX Short Term Elliott Wave view suggests that Intermediate wave (X) ended at 12731.46. Rally from there is unfolding as a 5 waves impulsive Elliott Wave structure where Minutte wave (i) ended at 12943, Minutte wave (ii) ended at 12881.5, Minutte wave (iii) ended at 13408.5, Minutte wave (iv) ended at 13328.5, and Minutte wave (v) of ((a)) is proposed complete at 13421.5. Index is correcting cycle from 1/2/2018 low within Minute wave ((b)) in 3, 7, or 11 swing before the rally resumes.
Internal of Minute wave ((b)) is unfolding as a zigzag Elliott Wave Structure where Minute wave (a) is proposed complete at 13219. While Minute wave (b) bounce fails below 13421.5, Index has scope to extend lower in Minute wave (c) of ((b)) to finish the zigzag correction. Afterwards, expect Index to resume higher as far as pivot at 1/2 low (12731.46) stays intact. We don’t like selling the Index and expect buyers to appear for more upside in 3, 7, or 11 swing, provided pivot at 1/2 low stays intact.
DAX 1 Hour Elliott Wave Chart
عضو المتداول العربي
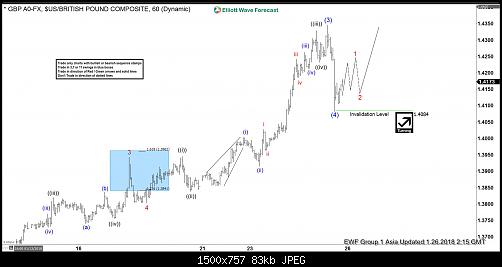
Elliott Wave Analysis: GBPUSD ended wave (4) correction
GBPUSD Short Term Elliott Wave view suggests that pair ended Intermediate wave (2) at 1.33 on 16 December 2017. Up from there, Intermediate wave (3) rally is unfolding as 5 waves impulse Elliott Wave structure where Minor wave 1 ended at 1.3613, Minor wave 2 ended at 1.3456, Minor wave 3 ended at 1.3943, Minor wave 4 ended at 1.3797, and Minor wave 5 of (3) ended at 1.434.
Pullback to 1.4084 today is proposed to have ended Intermediate wave (4) at 1.4084, but pair still needs to break above Intermediate wave (3) at 1.434 to confirm this view. Until then, a double correction in Intermediate wave (4) still can’t be ruled out. Near term, while pullbacks stay above 1.4084, but more importantly as far as pivot at 16 December 2017 low (1.33) stays intact, expect pair to extend higher. We don’t like selling the pair.
GBPUSD 1 Hour Elliott Wave Chart
عضو المتداول العربي
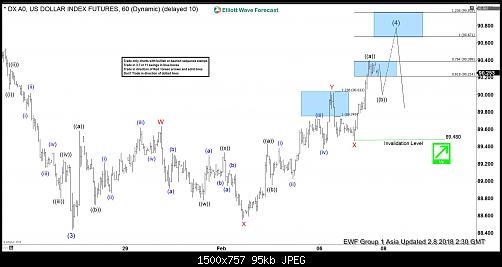
Elliott Wave Analysis: DXY extended correction as triple three
DXY Short Term Elliott Wave view suggests that the decline to 88.44 ended Intermediate wave (3). Up from there, correction in Intermediate wave (4) is in progress as a triple three Elliott Wave structure. Rally to 89.64 ended Minor wave W, decline to 88.55 ended Minor wave X, Minor wave Y ended at 90.03 and Minor second wave X ended at 89.48. Near term, while pullbacks stay above 89.48, Index has scope to extend higher to 90.67 – 90.95 area to end wave Z of (4) before the decline resumes. We don’t like buying the Index and expect sellers to appear from the above area for a 3 waves pullback at least
DXY 1 Hour Elliott Wave Chart
عضو المتداول العربي
Elliott Wave Analysis: Calling the low in place in Bitcoin
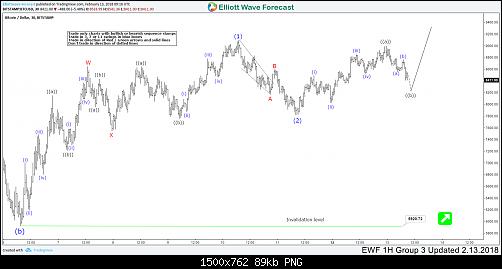
Bitcoin ticker symbol: ( BTCUSD ) Short Term Elliott Wave view suggests that the decline from December 17.2017 peak to February 05.2018 low (5920.72) ended the Super Cycle wave “(b)” lower. Above from there, the rally is unfolding as a leading diagonal Elliott Wave structure. Where Intermediate wave (1) ended at 9090.8 high as Elliott Wave Double three structure. Where internals of Intermediate wave (1) ended in Minor wave W at 8648.9 high and Minor wave X at 7543.3 low.
Below from 9090.8 high, the pair ended it’s short-term correction against 2/05 cycle in Intermediate wave (2) low at yesterday’s low 7820. The internals of Intermediate wave (2) unfolded as Elliott Wave Zigzag correction, where Minor wave A ended at 8170.9 and Minor wave B ended at 8589.1 high. Above from there, the pair is expected to resume the upside. However, a break of 9090.8 high remains to be seen to avoid the double correction lower in Intermediate wave (2) dip. Up from 9090.8 low, the rally is unfolding as Zigzag Elliott wave structure. Where Minute wave ((a)) ended in 5 waves at 8992.9 high, below from there, the pair is doing a short-term correction against 7820 low in 3, 7 or 11 swings within Minute wave ((b)) dip. Near-term, while dips remain above 7820 low and more importantly the pivot from 5920.72 low remains intact during the dips pair is expected to resume higher. We don’t like selling it into a proposed pullback.
BTCUSD 1 Hour Elliott Wave Chart