الأكثر زيارة
 رد مع اقتباس


عروض شركات الفوركس
 | |  | |  |  |  |

 عضو المتداول العربي
You are welcome
عضو المتداول العربي
Trading Edge through Swings Sequences
Most Elliott Wave Practitioners think that 5 wave move off a high / low provides them with a Trading Edge as according to Elliott Wave Theory, a 5 wave move should be followed by 3 waves back and another 5 wave move in the direction of the first 5 wave move. Experience has taught us that many a times, 5 wave moves can turn out to be part of an Elliott Wave FLAT which is a 3-3-5 structure and if so, representing the end of a corrective cycle rather than start of a new cycle and hence setting a trap for the traders. Therefore, we at Elliottwave-Forecast rely more on Swing Sequences than 5 wave moves to look for our “Trading Edge”.
Markets move in either Impulsive Sequences or Corrective Sequences. 5,9,13,17 and so on is an impulsive sequence whereas 3,7,11,15 and so on is a corrective sequence. We believe every Elliott wave practitioner in particular and trader in general should understand the swing sequences to get a better accuracy in their forecasts and avoid getting into traps which are often laid out by the market. As we know that 7 is a corrective sequence so if we see 5 swings up with biggest correction in the middle (which is too big to be wave 4 of an impulse), then we know the sequence is incomplete and it presents a “Trading Edge” to buy the 6th swing pull back to trade the 7th swing higher. Below, we will present an example of EURAUD forex pair showing 5 swings sequence up from 7/19 (1.4418) low suggesting the sequence is bullish against 9/20 (1.4785) low and 6th swing pull back should represent a buy opportunity in 3, 7 or 11 swings with a target of 1.5543 – 1.5722 area.
EURAUD 5 swings sequence provides a “Trading Edge”
We understand that not all traders are able to identify these incomplete sequences which provide a “Trading Edge” to traders, so when ever we spot an Incomplete swings sequence on our charts, we put a Bullish Sequence or Bearish Sequence stamp on the chart for our clients to know they should be looking to buy or sell that particular instrument in 3, 7 or 11 swings. Not every instrument has a Bullish or Bearish sequence all the time but we cover 78 instruments in total so there are always some showing Bullish or Bearish swings sequence in different time frames.
عضو المتداول العربي
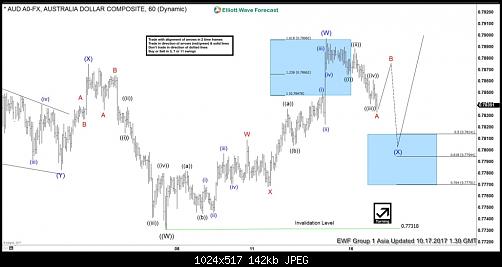
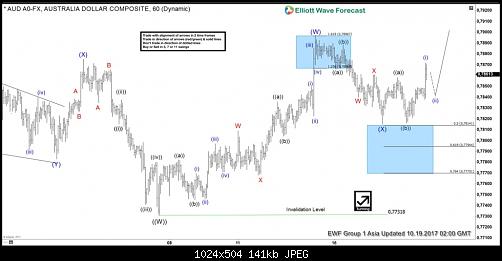
AUDUSD Short Term Elliott Wave Analysis 10.17
AUDUSD Short term Elliott Wave analysis suggests decline to 0.7731 ended Primary wave ((W)) on 10/6 low. Bounce in Primary wave ((X)) is proposed to be unfolding as a double three Elliott Wave structure. Intermediate wave (W) of ((X)) ended at 0.7897 and Intermediate wave (X) of ((X)) pullback is in progress as a zigzag Elliott Wave structure. Down from 0.7897 high, Minor wave A is proposed complete at 0.7832. While Minor wave B bounce stays below 0.7897, pair should turn lower in Minor wave C of (X) to correct cycle from 10/6 low. Afterwards, as far as pivot at 10/6 low (0.7731) stays intact, expect pair to resume higher.
AUDUSD 1 Hour Elliott Wave Chart
عضو المتداول العربي
what u recommend best elliott wave books ?
thanx
عضو المتداول العربي
You can start with " The wave principal " and then take a look at " The Definitive Guide of Elliott wave forecast "المشاركة الأصلية كتبت بواسطة bonokio

عضو المتداول العربي
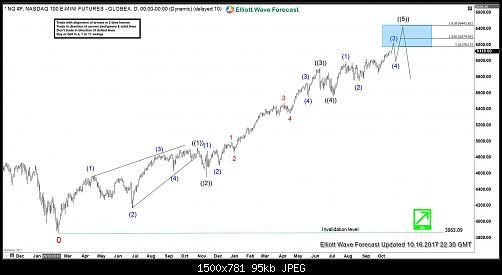
NASDAQ Futures: Impulsive Rally
NASDAQ Futures rally from 2.11.2016 low is unfolding as an Elliott Wave Impulse as we can clearly see three channels in price and momentum (RSI) to support this idea. Wave ((1)) ended at 4919.50 as a diagonal, wave ((2)) ended at 4558.50,wave ((3)) completed at 5907.50 and dip to 5560 completed wave ((4)) on 7.5.2017. Up from there, so far we can only see three swings up and as wave ((5)) can’t be in 3 swings, we expect to see more upside in NASDAQ Futures to complete wave ((5)) which should also end the cycle from 2.11.2016 low. Near-term focus is on 6178 – 6279 area to complete wave (3) of ((5)) before we get a pull back in wave (4) to correct the cycle from 8.21.2017 (5752) low and higher again towards 6443 – 6604 area to complete wave ((5)).
Wave (3) of diagonal wave ((5)) is proposed to be unfolding as a double three WXY structure where wave W ended at 6019.75 and wave X ended at 5842. Index has already reached 100% extension of W-X at 6108 but has not yet reached 100% extension up from red X low so while dips stay above 10.10.2017 (6039), expect NADSAQ Futures to extend higher towards 6178 – 6279 area to complete wave (3). Break below 10.10.2017 (6039) low would suggest cycle from 5842 low ended and would favor the view that wave (3) also ended and NASDAQ Futures are already in wave (4) pull back to correct the cycle from 8.21.2017 low. Index has already reached 100% extension of W-X so we don’t like chasing strength here and don’t even like selling the Index. We see wave (4) dips when seen to offer the next ideal buying opportunity in 3, 7 or 11 swings.
NASDAQ Futures Daily Chart
عضو المتداول العربي
ok i save it thanx aloooot
عضو المتداول العربي
You are welcome
عضو المتداول العربي
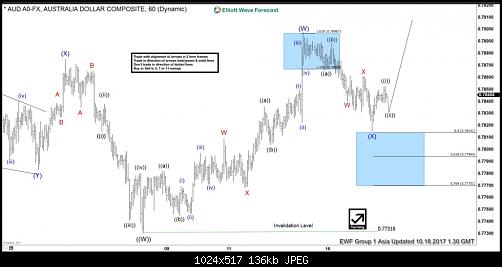
AUDUSD Elliott Wave Analysis 10.18
AUDUSD Elliott Wave structure suggests that the decline to 0.7731 on October 6th low ended Primary wave ((W)). From there, Primary wave ((X)) bounce is unfolding as a double three Elliott Wave structure. Rally to 0.7807 ended Intermediate wave (W) of ((X)) and pullback to 0.7815 ended Intermediate wave (X) of ((X)). A break above Intermediate wave (W) at 0.7815 will give more validity to this view. Until then, a double correction in Intermediate wave ((X)) is still possible. Near term, while pullbacks stay above 0.7815, but more importantly above 10/6 low at 0.7731, expect pair to extend higher.
AUDUSD 1 Hour Elliott Wave Chart
عضو المتداول العربي
Copper swings sequences calling the rally
Hello fellow traders. In this technical blog we’re going to take a quick look at the past Elliott Wave charts of Copper published in members area of elliottwave-forecast. In further text we’re going to count the swings, explain the short term Elliott Wave view.
Copper Elliott Wave 1 Hour Chart 10.10.2017
As our members know, Copper has had incomplete bullish sequences in larger time frames targeting 3.363 area. Consequently, we advised members to avoid selling and keep buying the dips in 3,7,11 swings. On 9th October Copper has made new short term high that made sequences bullish in the short term cycle as well. With new high we assumed that 9th swing is in progress. That means short term cycle from the 09/22 low is also having incomplete sequences . As of right now, 11th swings up are required to complete proposed cycle.
We’re labeling proposed cycle as a Triple Three structure. Second ((x)) connector is counted completed at 3.011 low and we’re about to complete short term x red pull back. As far as the mentioned level holds, we expect further rally.
Shortly after Copper found buyers , and make further separation from the 3.011 low, eventually breaking above 09/04 peak. Keep in mind market is very dynamic. If you’re interested in new Elliott Wave forecasts of Copper you can find them in the membership area of EWF.
عضو المتداول العربي
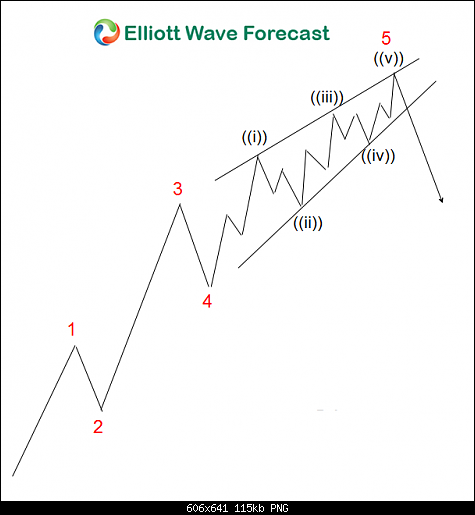
Elliott Wave Theory Structure; An Ending Diagonal
An ending diagonal is a type of impulsive motive wave in Elliott Wave Theory that will be found in the subdivision of fifth waves or whole C waves in a structure. An ending diagonal C wave or 5th wave commonly shows an obvious wedge shape with an overlapping wave 1 and wave 4. These will subdivide into 3-3-3-3-3 however an overlapping wave 1 and wave 4 are not required conditions that must be met. The overlap may or may not happen thus it is acceptable for there to not be any overlap. These structures will appear in either bullish or bearish markets in all time frames. For reference shown at the bottom there is a couple of bullish examples the above mentioned wave C’s & 5th’s describes.
There are a few conditions that ending diagonal waves have in common with a regular impulse. Firstly the whole structure will be five waves however it will subdivide into the aforementioned 3-3-3-3-3 instead of 5-3-5-3-5. Secondly the wave three will not be the shortest of the five wave move thus either the wave one or the fifth wave will be shorter than the wave three. Finally the fifth wave of a bullish market ending diagonal will have a lower momentum reading such as on a RSI indicator where it will be showing some divergence compared to the wave three. Correspondingly in a bearish market ending diagonal the wave three will have the lower momentum indicator or RSI reading when compared to the wave five.
Keep in mind a five wave motive, whether a regular impulse with the 5th wave being an ending diagonal or an ending diagonal wave C itself will be commonly seen in the larger double three combination structures such as in the C wave ending moves of zig-zags as well as in flats of each of the three types .
عضو المتداول العربي
AUDUSD Intra Day Elliott Wave Analysis
AUDUSD Short Term Elliott Wave view suggests that Primary wave ((W)) ended at 0.7731 on October 6th low. Up from there, Primary wave ((X)) is currently unfolding as a double three Elliott Wave structure. Intermediate Wave (W) of ((X)) ended at 0.7807 and Intermediate wave (X) of ((X)) ended at 0.7815. Near term, while pullbacks stay above 0.7815, but more importantly above 10/6 low at 0.7731, expect pair to extend higher. At this stage, pair still needs to break above Intermediate wave (W) at 0.7815 to give more validity to this view. Until then, we can’t rule out a double correction in Intermediate wave ((X)).
AUDUSD 1 Hour Elliott Wave Chart
عضو المتداول العربي
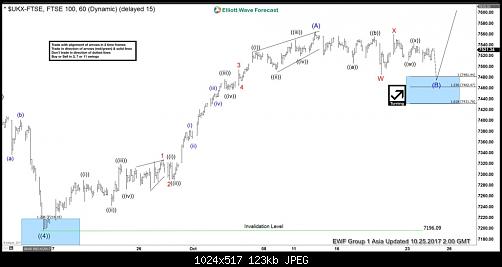
FTSE Intra Day Elliott Wave Analysis
FTSE Elliott Wave view suggests that Primary wave ((4)) ended with the decline to 7199.5. Up from there, rally is unfolding as an impulse Elliott Wave structure where Minor wave 1 ended at 7327.5 and Minor wave 2 ended at 7289.75. Rally to 7494.34 ended Minor wave 3, and pullback to 7473.12 ended Minor wave 4. The last leg Minor wave 5 ended at 7565.11 and this also ended Intermediate wave (A) of a zigzag Elliott Wave structure from 9/15 low (7199.5).
Intermediate wave (B) is currently in progress as a double three Elliott Wave structure. From 7565.11 high, Minor wave W ended at 7485.42 and Minor wave X bounce ended at 7560.04. Near term, while bounces stay below 7565.11, expect the Index to turn lower towards 7431 – 7481 area to complete Intermediate wave (B). Afterwards, Index should resume the rally to new high or at least bounce in 3 waves. We don’t like selling the proposed pullback.
FTSE 1 Hour Elliott Wave Analysis
عضو المتداول العربي
Elliott wave: Are the Indices ending 5 waves or not?
Elliott wave: The 5 waves advance
The Elliott wave Theory is a famous trading tool and is based in the idea that the Market advances in 5 waves and corrects in 3 waves. The Theory has some basic rules which are listed below
1) Wave 2 never retraces more than 100% of wave 1.
2) Wave 3 cannot be the shortest of the three impulse waves, namely waves 1, 3 and 5.
3) Wave 4 does not overlap with the price territory of wave 1, except in a diagonal formation.
Elliott Wave Theory: A 5 waves Advance
These rules are the ones which appear in a 5 waves advance but also the one that make traders around the globe to be misled into trading on wrong side of the Market. Many traders develop the habit to pick tops and trade into corrections when they see what looks like a 5 waves move and believe that a pullback or sell off is imminent. The reality is that those 3 rules are not enough and we have been saying for years that the Theory is too simple and too old to be used without any other tools. We have added several new rules or conditions to validate the Market and consequently gain an edge over the Market and the theory itself. In this blog, we will explain why the YM #F which is the Dow Jones Futures is being wrongly counted as a 5 waves move from 2 significant lows i.e. the 2009 cycle and the 2.2016 low cycle. We believe wave 5 in an advance needs to provided momentum divergence against the peak of wave 3 , otherwise the move is either corrective and ending a 3 waves advances or even more powerful when the market is still within the wave 3 with the waves 4 and 5 to come. Let’s now take a look at the charts below
YM#F Cycle from 2.2016 low: 5 Waves or not?
The Chart above is showing the cycle since 2.2016 low and if we look at RSI at the bottom of the chart, we can see that move from 8.2017 low has erased RSI divergence with respect to 3.2017 peak , in other words RSI is currently at the highest level since the move started from 2.2016 low so we are either ending the whole cycle as a 3 waves corrective sequence or still within wave 3 of a 5 waves advance.
YM#F Cycles from 2009 low (Price and RSI)
The Chart above is showing the cycle since lows at 2009 and we can see how the price have erased the divergence within the cycle and showing 5 swings, meaning it’s not a 5 waves advance. We can see how both cycles have erased divergence compared to the higher read within the cycle which mean that current rally is the peak in both degrees and more upside should happen in the long term cycles. The Market is a combinations of cycles and time frames and traders need to upgrade and downgrade the Instrument be able to provide a reliable forecast or wave count. We are always trying to help members and non-members to understand the Elliott wave Theory and applying it to according to the current times instead of following the theory in it’s original form which is too simple and without additional tools, doesn’t help to avoid falling into the traps laid out by the Market every day. The Relative Strength Index (RSI), developed by J. Welles Wilder, is a momentum oscillator that measures the speed and change of price movements. The RSI oscillates between zero and 100, the instrument gather the strength of the move and we used every day in our charts and forecast, we always aid a wavers without the RSI won’t be able to get the desired results and today the proof is that, we are not ending a 5 waves move in the YM# F (Dow Jones). We are either ending wave 3 with 4 and 5 to come or we are ending a correcting advance since the lows at 2.2016. We do understand the optical view of the 5 waves advances but the RSI is denying the notion of 5 waves so it’s better to find a count which fit the criteria instead of forcing and eventually falling into the trap. The cycle from 2.2016 can end soon and provide a pullback and another chance to buy, but if the pullback happens without a 4-5, then the structure will become corrective from 2009 and 2016 cycle.
عضو المتداول العربي
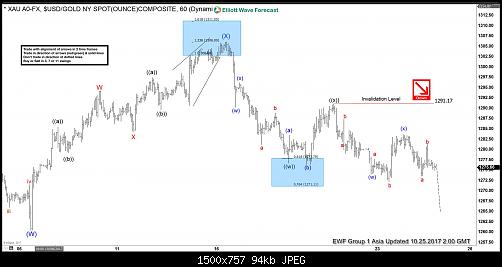
Gold Elliott wave view: Double three
Short term Gold Elliott Wave view suggests that the rally from 10/06 low (1260.52) to 10/16 peak (1306.35) ended intermediate wave (X) then the decline from there is unfolding as a a double three Elliott wave structure. As the structure of the 10/16 peak looks to be overlapping, hence suggesting its corrective structure, either W, X, Y or W, X, Y, Z.
The first leg lower ended in Minute wave ((w)) at 1276.34 & bounce to 1291.17 ended Minute wave ((x)). Minute wave ((y)) currently in progress as double three structures. Where Minutte wave (w) ended at 1272.43 low and Minutte wave (x) bounce at 1283.54 as a flat. Near term, as far as bounces fails below 1291.17 peak metal has scope to extend 1 more push lower towards 1261.19-1254.42 100%-123.6% Fibonacci extension area from 10/16 peak. Afterwards it should end the cycle from 10/16 peak and should do a 3 wave bounce minimum. We don’t like buying the metal and as far as bounces fails below the 1291.17 peak and more importantly the pivot from 10/16 peak stays intact metal is expected to trade lower.
Gold 1 Hour Elliott Wave Chart