

 الأكثر زيارة

 رد مع اقتباس
عروض شركات الفوركس
 | |  | |  |  |  |

 موقوف
موقوف
السلامة عليكم
مؤشر جميل ، قوي جدا على فريم اليومي
بحثت عنه في جميع المواقع لم اجده
او بالاحرى لا يوجد بصيغة mt
لا اعرف السبب ! مع انه من اقوى المؤشرات
مشاهدتي له عن طريق الصدفة في منصة kiwi trader
ارجو من الاخوة المبرمجين صياغته ليعمل كمؤشر للميتا تريدر
موقوف
EFS Code:
PHP Code:
/*********************************
Provided By:
eSignal (Copyright c eSignal), a division of Interactive Data
Corporation. 2009. All rights reserved. This sample eSignal
Formula Script (EFS) is for educational purposes only and may be
modified and saved under a new file name. eSignal is not responsible
for the functionality once modified. eSignal reserves the right
to modify and overwrite this EFS file with each new release.
Description:
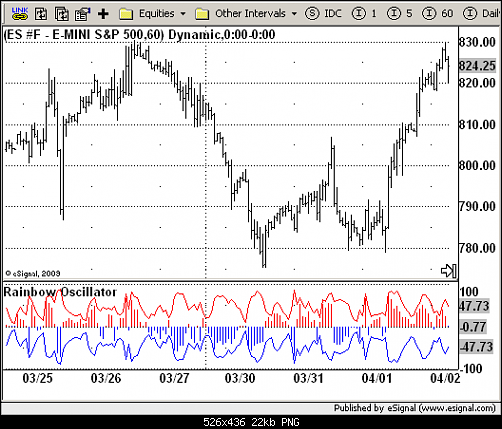
Rainbow Oscillator
Version: 1.0 04/29/2009
Formula Parameters: Default:
Length 2
Levels 10
Source of Price Close
Notes:
Mel Widner introduced a colorful technique for plotting an indicator to
signal trend changes. The indicator is derived from a consensus of trends
that, when plotted in color, has the appearance of a rainbow.
**********************************/
var fpArray = new Array();
var bInit = false;
function preMain() {
setPriceStudy(false);
setStudyTitle("Rainbow Oscillator");
setCursorLabelName("URB", 0);
setCursorLabelName("LRB", 1);
setCursorLabelName("RainbowOsc", 2);
setDefaultBarFgColor(Color.red, 0);
setDefaultBarFgColor(Color.blue, 1);
setDefaultBarFgColor(Color.yellow, 2);
setPlotType(PLOTTYPE_LINE, 0);
setPlotType(PLOTTYPE_LINE, 1);
setPlotType(PLOTTYPE_HISTOGRAM, 2);
setStudyMax(101);
setStudyMin(-101);
var x = 0;
fpArray[x] = new FunctionParameter("Length", FunctionParameter.NUMBER);
with(fpArray[x++]) {
setLowerLimit(1);
setDefault(2);
}
fpArray[x] = new FunctionParameter("Levels", FunctionParameter.NUMBER);
with(fpArray[x++]) {
setLowerLimit(0);
setUpperLimit(10);
setDefault(10);
}
fpArray[x] = new FunctionParameter("sPrice", FunctionParameter.STRING);
with(fpArray[x++]){
setName("Source of Price");
addOption("open");
addOption("high");
addOption("low");
addOption("close");
addOption("hl2");
addOption("hlc3");
addOption("ohlc4");
setDefault("close");
}
}
var xRainbowBW = null;
var xRainbowOsc = null;
function main(sPrice, Length, Levels) {
var nBarState = getBarState();
var nRainbowBW = 0;
var nRainbowOsc = 0;
if (nBarState == BARSTATE_ALLBARS) {
if (sPrice == null) sPrice = "close";
if (Length == null) Length = 2;
if ((Levels == null) || (Levels > 10) || (Levels <= 0)) Levels = 10;
}
if (bInit == false) {
xRainbowBW = efsInternal("Calc_Rainbow", sPrice, Length, Levels);
xRainbowOsc = getSeries(xRainbowBW, 1);
bInit = true;
}
nRainbowBW = xRainbowBW.getValue(0);
nRainbowOsc = xRainbowOsc.getValue(0);
if (nRainbowOsc == null) return;
if (nRainbowOsc > 0) setBarFgColor(Color.red, 2);
else setBarFgColor(Color.blue, 2);
return new Array(nRainbowBW, -nRainbowBW, nRainbowOsc);
}
var bSecondInit = false;
var xPrice = null;
var xMA1 = null;
var xMA2 = null;
var xMA3 = null;
var xMA4 = null;
var xMA5 = null;
var xMA6 = null;
var xMA7 = null;
var xMA8 = null;
var xMA9 = null;
var xMA10 = null;
var xHH = null;
var xLL = null;
function Calc_Rainbow(sPrice, Length , Levels) {
var Avg = new Array(0,0,0,0,0,0,0,0,0,0);
var nRainbowBW = 0;
var nRainbowOsc = 0;
var HiPrice = 0;
var LoPrice = 0;
var HiAvg = 0;
var LoAvg = 0;
var AvgAvgs = 0;
var i = 0;
if (bSecondInit == false) {
xPrice = eval(sPrice)();
xMA1 = sma(Length, xPrice);
xMA2 = sma(Length, xMA1);
xMA3 = sma(Length, xMA2);
xMA4 = sma(Length, xMA3);
xMA5 = sma(Length, xMA4);
xMA6 = sma(Length, xMA5);
xMA7 = sma(Length, xMA6);
xMA8 = sma(Length, xMA7);
xMA9 = sma(Length, xMA8);
xMA10 = sma(Length, xMA9);
xHH = upperDonchian(Levels, xPrice);
xLL = lowerDonchian(Levels, xPrice);
bSecondInit = true;
}
Avg[0] = xMA1.getValue(0);
Avg[1] = xMA2.getValue(0);
Avg[2] = xMA3.getValue(0);
Avg[3] = xMA4.getValue(0);
Avg[4] = xMA5.getValue(0);
Avg[5] = xMA6.getValue(0);
Avg[6] = xMA7.getValue(0);
Avg[7] = xMA8.getValue(0);
Avg[8] = xMA9.getValue(0);
Avg[9] = xMA10.getValue(0);
HiPrice = xHH.getValue(0);
LoPrice = xLL.getValue(0);
if (Avg[9] == null) return;
HiAvg = Avg[0];
LoAvg = Avg[0];
for (i = 0; i < Levels; i++) {
if (Avg[i] > HiAvg) HiAvg = Avg[i];
if (Avg[i] < LoAvg) LoAvg = Avg[i];
}
for (i = 0; i < Levels; i++) {
AvgAvgs += Avg[i];
}
AvgAvgs = AvgAvgs / Levels;
if ((HiPrice - LoPrice) != 0) {
if (xPrice.getValue(0) > HiAvg) HiAvg = xPrice.getValue(0);
if (xPrice.getValue(0) < LoAvg) LoAvg = xPrice.getValue(0);
nRainbowBW = 100 * ((HiAvg - LoAvg) / (HiPrice - LoPrice));
nRainbowOsc = 100 * ((close(0) - AvgAvgs) / (HiPrice - LoPrice));
}
return new Array(nRainbowBW, nRainbowOsc);
}
