

 الأكثر زيارة
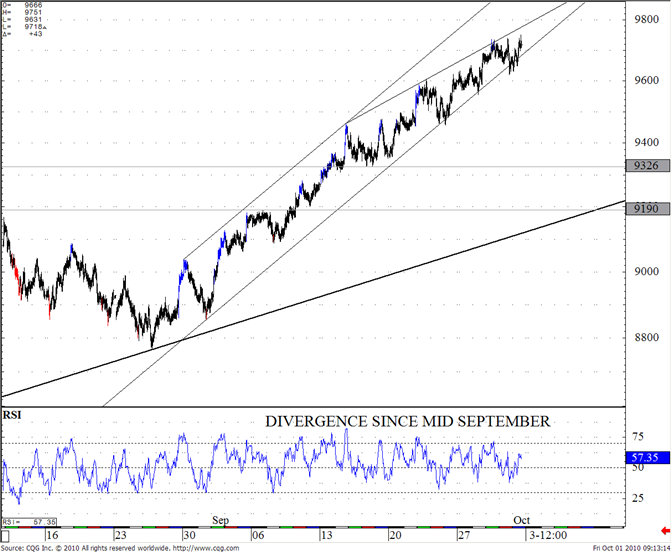

 رد مع اقتباس
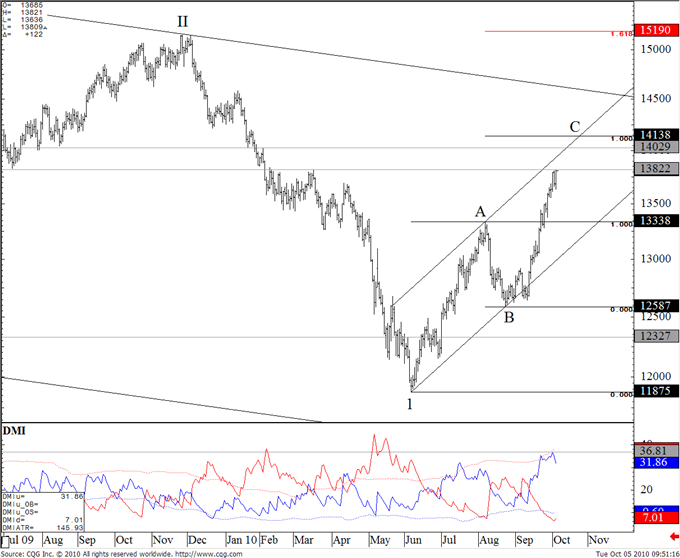
عروض شركات الفوركس
 | |  | |  |  |  |

 عضو المتداول العربي
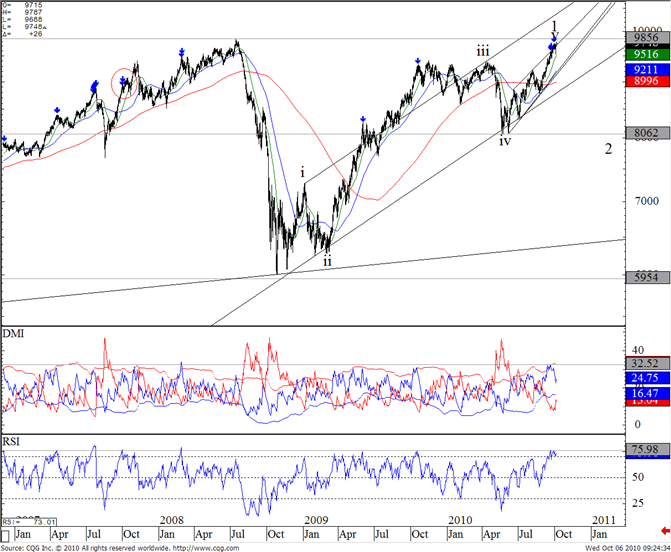
Australian Dollar Bull Trend Strongest Since Early 2008
شارت الساعة
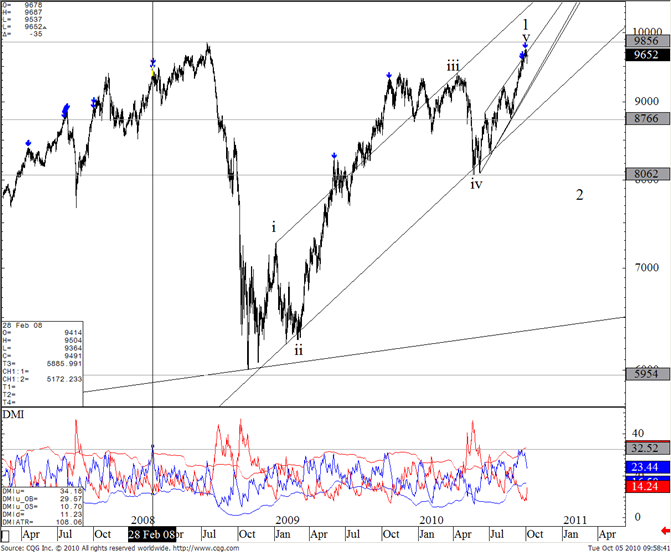
“My preferred AUDUSD count suggests that the ending diagonal from 8070 is a 5th wave within a 5 wave advance from the 2008 low. With price testing the upper diagonal line, expectations are for a top and reversal. Also, wave 5 would equal wave 1 (in %) at 9660. Equality among these waves is common. It is possible too that the rally extends much higher to test the 1-3 line and even the next measurement closer to 10500. The short term patterns will be watched for clues. Near term, there is the risk of a move back to at least 9325 as the move from there is overlapping (and probably a diagonal).” A move below 9620 is needed before we can attempt a short. It is worth noting that 14 day DMI is at its highest since February 2008. At that time, the AUDUSD topped and declined 500 pips over the next 3 weeks.
عضو المتداول العربي
Euro Bulls Not Giving Up
شارت اليومي
Eventually, the EURUSD is expected to reach the 100% extension of the 11875-13340 rally at 14140 in order to complete the 3 wave rally from the June low (intersects with corrective channel on October 25). Clearly, the uptrend is exceptionally strong and probably a bit too strong at the moment. 14 day DMI is at its highest level since December 2008, which saw the 14700 top. A pullback is expected to begin this week in a 4th wave that should reach at least 13445 and maybe 13285.
لا يزال النظرة للتصحيح عند الموجة الرابعة والتي من المتوقع ان تكون اهدافها 13445 او 13285 قبل اكمال الهدف النهائي للموجة الكبيرة C للموجة الاكبر منها 2 . ويلفت انتباهنا الى ان مؤشر DMI 14 day في أعلى مستوياته من سنة 2008
يتوقع ان يبدأ لاتصحيح هذا الاسبوع الى الاهداف المذكورة .
عضو المتداول العربي
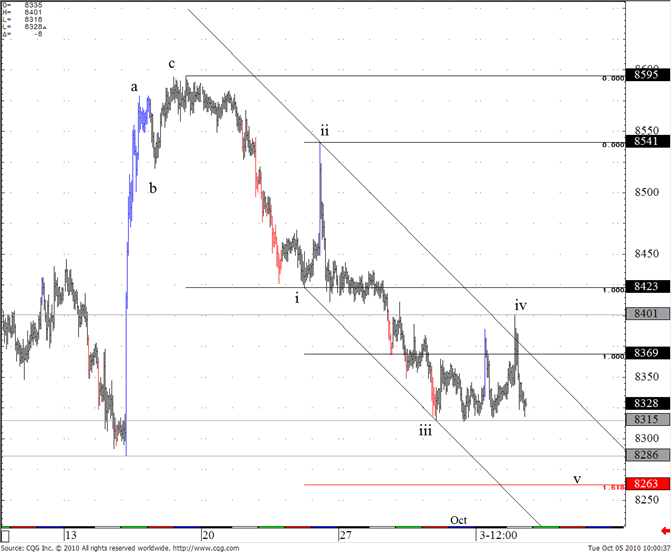
Japanese Yen Heading for Test of September Extreme
شارت الساعة
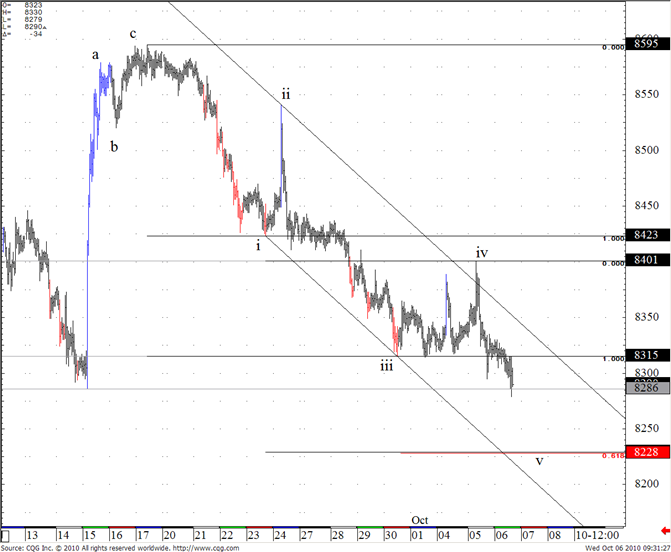
The rally from 8290 is in 3 waves, which is corrective. With last night’s rally reversing close to Elliott channel resistance, look lower in a 5th wave. Price should break below 8285 before finding support. 8260 is a Fibonacci objective and thus potential support. 8400 is now the pivot.
عضو المتداول العربي
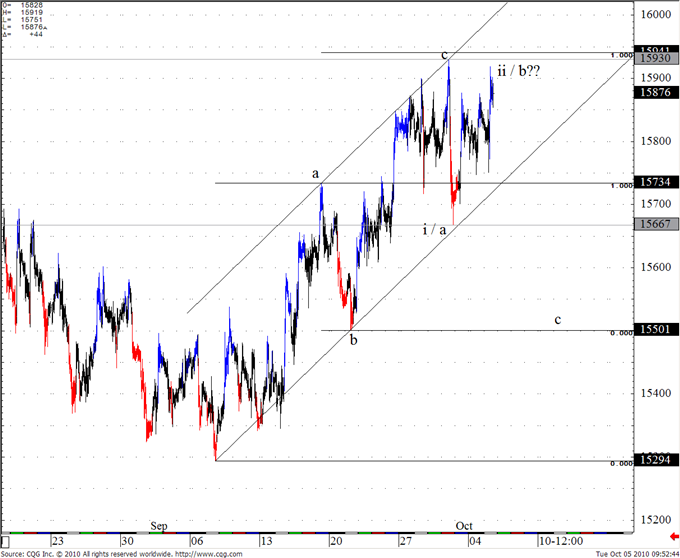
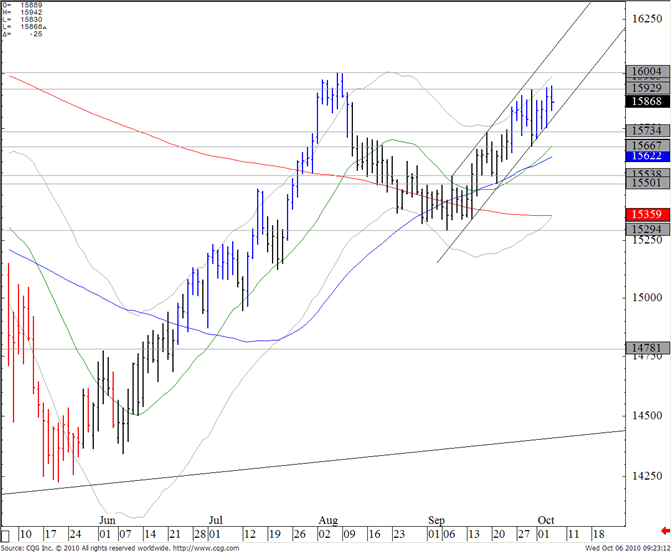
British Pound Pressing against Range High
شارت الساعة
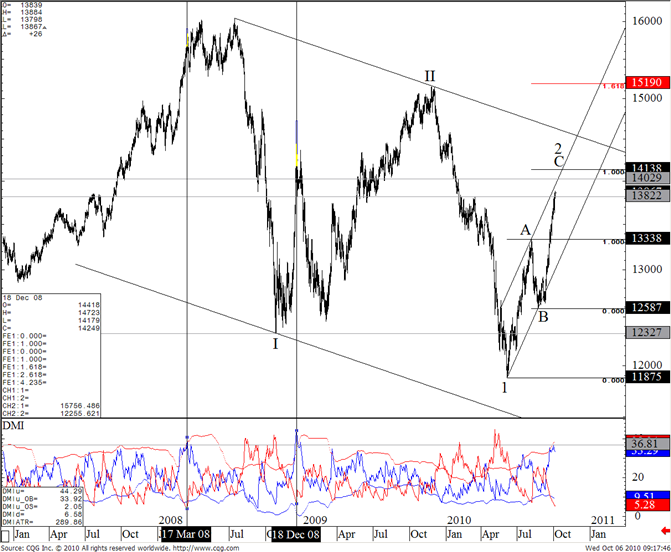
Bigger picture - “I am of the mind that a large triangle is underway since the January 2009 low. The implications are bullish over the next few months (allowing for a correction over the next several weeks down to 15450-15500), with triangle wave C working towards 16500 before a reversal and multi month decline in triangle wave d.” Near term, I expect a drop lower in a small c wave to 15500. 15930 needs to remain intact for this short term bearish bias to remain favored.
لا تزال النظرة هبوطية , وهو يتوقع الوصول الى 155 , وقد رفع الستوب الى ما فوق 1.5930
عضو المتداول العربي
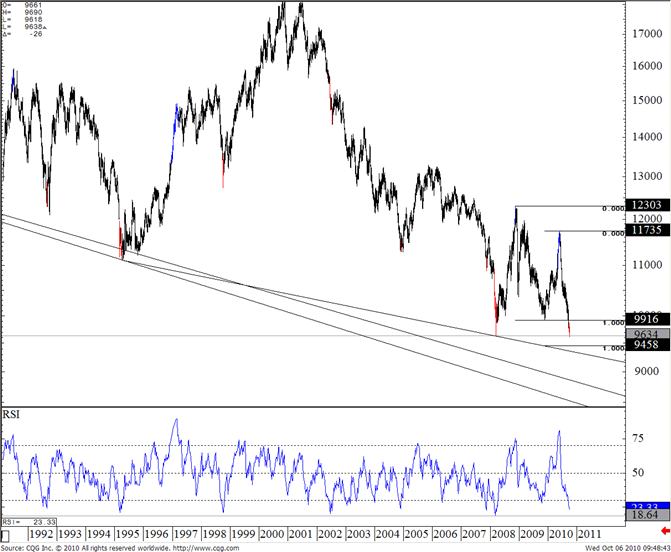
Swiss Franc Ready to Break?
شارت الاسبوعي
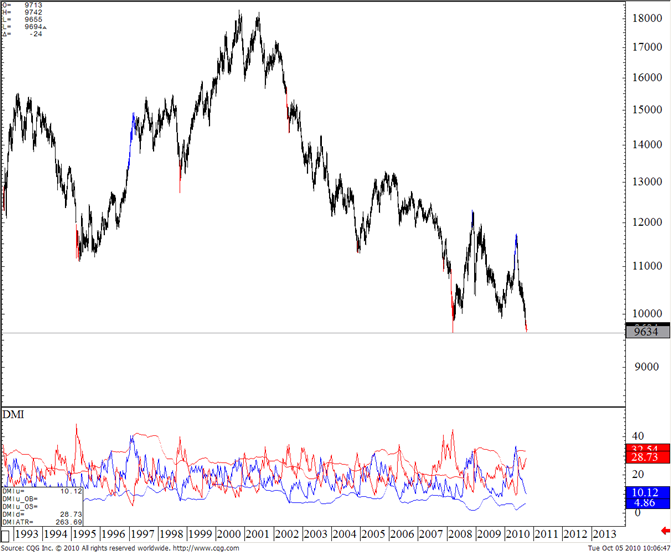
There remains little to say about the USDCHF. The drop below 9915 could complete a 2 year correction from 12300. Clearly, confidence in this pattern is low at this point but the pattern does remain valid. The RSI divergence on the daily does warn of a reversal. The red painted bars indicate instances when RSI has been below 25 (13 week RSI). In all instances, weakness continued for a few weeks before the USDCHF reversed. In 3 of the last 4 instances, the reversals were significant. A new low looks likely, but RSI suggests that the thrust will be into an important low.
عضو المتداول العربي
Australian Dollar Reversal Evidence Mounts
شارت اليومي
“My preferred AUDUSD count suggests that the ending diagonal from 8070 is a 5th wave within a 5 wave advance from the 2008 low. With price testing the upper diagonal line, expectations are for a top and reversal. Also, wave 5 would equal wave 1 (in %) at 9660. Equality among these waves is common (the high at 9750 is acceptable when dealing with longer term error). Near term, there is the risk of a move back to at least 9325 as the move from there is overlapping (and probably a diagonal).” It is worth noting that 14 day DMI is at its highest since February 2008. At that time, the AUDUSD topped and declined 500 pips over the next 3 weeks. The blue arrows indicate instances when Daily RSI(14) was above 75. Near term, the drop below 9620 favors the downside.
عضو المتداول العربي
Euro Channel Resistance at 13950 Today
شارت اليومي
The EURUSD continues to advance and channel resistance is at 13950 today. Eventually, the EURUSD is expected to reach the 100% extension of the 11875-13340 rally at 14140 in order to complete the 3 wave rally from the June low (intersects with corrective channel on October 25). 14 day DMI (directional movement) is at its highest level since December 2008, which saw the 14700 top. A pullback would encounter support at 13640 and then
13510.
يشير الى ان سقف القناة عند 13950 هي المقاومة لليوم , ولا يزال مصر على التصحيح الى اسفل
آخر تعديل بواسطة عبدالكريم ، 06-10-2010 الساعة 06:18 PM
عضو المتداول العربي
Japanese Yen Near Term Objective at 8230
شارت الساعة
I wrote yesterday that “the rally from 8290 is in 3 waves, which is corrective. With last night’s rally reversing close to Elliott channel resistance, look lower in a 5th wave. Price should break below 8285 before finding support.” The USDJPY has dropped to a new low and a potential support level is 8230, which is where wave 5 would equal wave 1 and where wave 5 would equal 61.8% of waves 1 through 3.
عضو المتداول العربي
British Pound Holding Channel Support
شارت اليومي
Bigger picture - “I am of the mind that a large triangle is underway since the January 2009 low. The implications are bullish over the next few months (allowing for a correction over the next several weeks down to 15450-15500), with triangle wave C working towards 16500 before a reversal and multi month decline in triangle wave d.” Near term, the trend must be considered up until a break below the channel that has held since early September. Coming below there would shift focus to 15670-15735 and then 15500/40.
عضو المتداول العربي
Swiss Franc All-Time High (USDCHF Low)-9460 a Level of Interest
شارت الاسبوعي
The red painted bars indicate instances when RSI has been below 25 (13 week RSI). In all instances, weakness continued for a few weeks before the USDCHF reversed. In 3 of the last 4 instances, the reversals were significant. An extension at 9460 is a level to keep in mind as potential support.
عضو المتداول العربي
Australian Dollar a Stones Throw from 98
شارت اليومي
“My preferred AUDUSD count suggests that the ending diagonal from 8070 is a 5th wave within a 5 wave advance from the 2008 low. With price just above the upper diagonal line, expectations are for a top and reversal.” It is dangerous to trade from the short side until price can break below the RBA low of 9540. It is worth noting that 14 day DMI was recently at its highest since February 2008. At that time, the AUDUSD topped and declined 500 pips over the next 3 weeks. The blue arrows indicate instances when Daily RSI(14) was above 75.
